Subtheme: Quantifying Condo Conversions
Overall Analysis Questions
The article "Renters at a brand-new Somerville building surprised by news: Millbrook's going condo" outlines a tale of a building in Somerville that was converted into condos. Interestingly, the building was constructed only the year prior to the announcement for conversion. Renters were not informed of the transition, and they were displaced from their homes if they could not afford buying the unit. Some of these rentals were specifically set aside for low-income individuals. This sad story made me question the prevalence and potential societal impacts of condo conversions. Are they occuring equitably or are segments of the population targeted more frequently? Which areas are specifically convertted? What economic incentives exist for condo conversions? By analyzing data on these conversions and uncovering trends, the nature of condo conversions in Boston can be further understood, providing insight to residents, building owners, and policy makers. First, I wanted to direct my focus into understanding which buildings are likely suspects for conversion, potentially identifying trends in conversions. Next, I wanted to find areas in Boston that experienced the most conversions to clarify the motivations behind these decisions and their geographic/economic ties. Finally, I wanted to better explore the effect of these changes on property and land values, displaying the financial repercussions of these decisions. Ultimately, my guiding questions were focused on the motivations and effects of condo conversions in Boston, with more focused subquestions in each section. These larger questions lead me to generate the following three questions for my analysis.
- What buildings are most likely to get converted?
- Where do condo conversions happen in Boston?
- How does the value of property change?
Discoveries & Insights
Each of the questions were explored with an initial exploration into the data quality and profiling of the fields. A particular focus was directed towards data explored in the guiding questions, searching for potential lapses in data quality and observing base level trends. Following this analysis, there is a deep dive into the question and specific fields that may help to answer the question better.Preliminary Dataset Understanding
Before diving into a deeper analysis, I had to first figure out what each of the LU codes stood for. Based on the Property Assessment guidelines, here are the LU codes used in this dataset:
- A - Residential 7 or more units
- E - Tax exempt
- AH - Agricultural/Horticultural
- EA - Tax exempt (121A)
- C - Commercial
- I - Industrial
- CC - Commercial condominium
- R1 - Residential 1 family
- CD - Residential condominium unit
- R2 - Residential 2 family
- CL - Commercial land
- R3 - Residential 3 family
- CM - Condominium main (physical structure housing all related condo units with no assessed value)
- R4 - Residential 4 or more family
- RC - Mixed use (res. and comm.)
- CP - Condo parking
- RL - Residential land
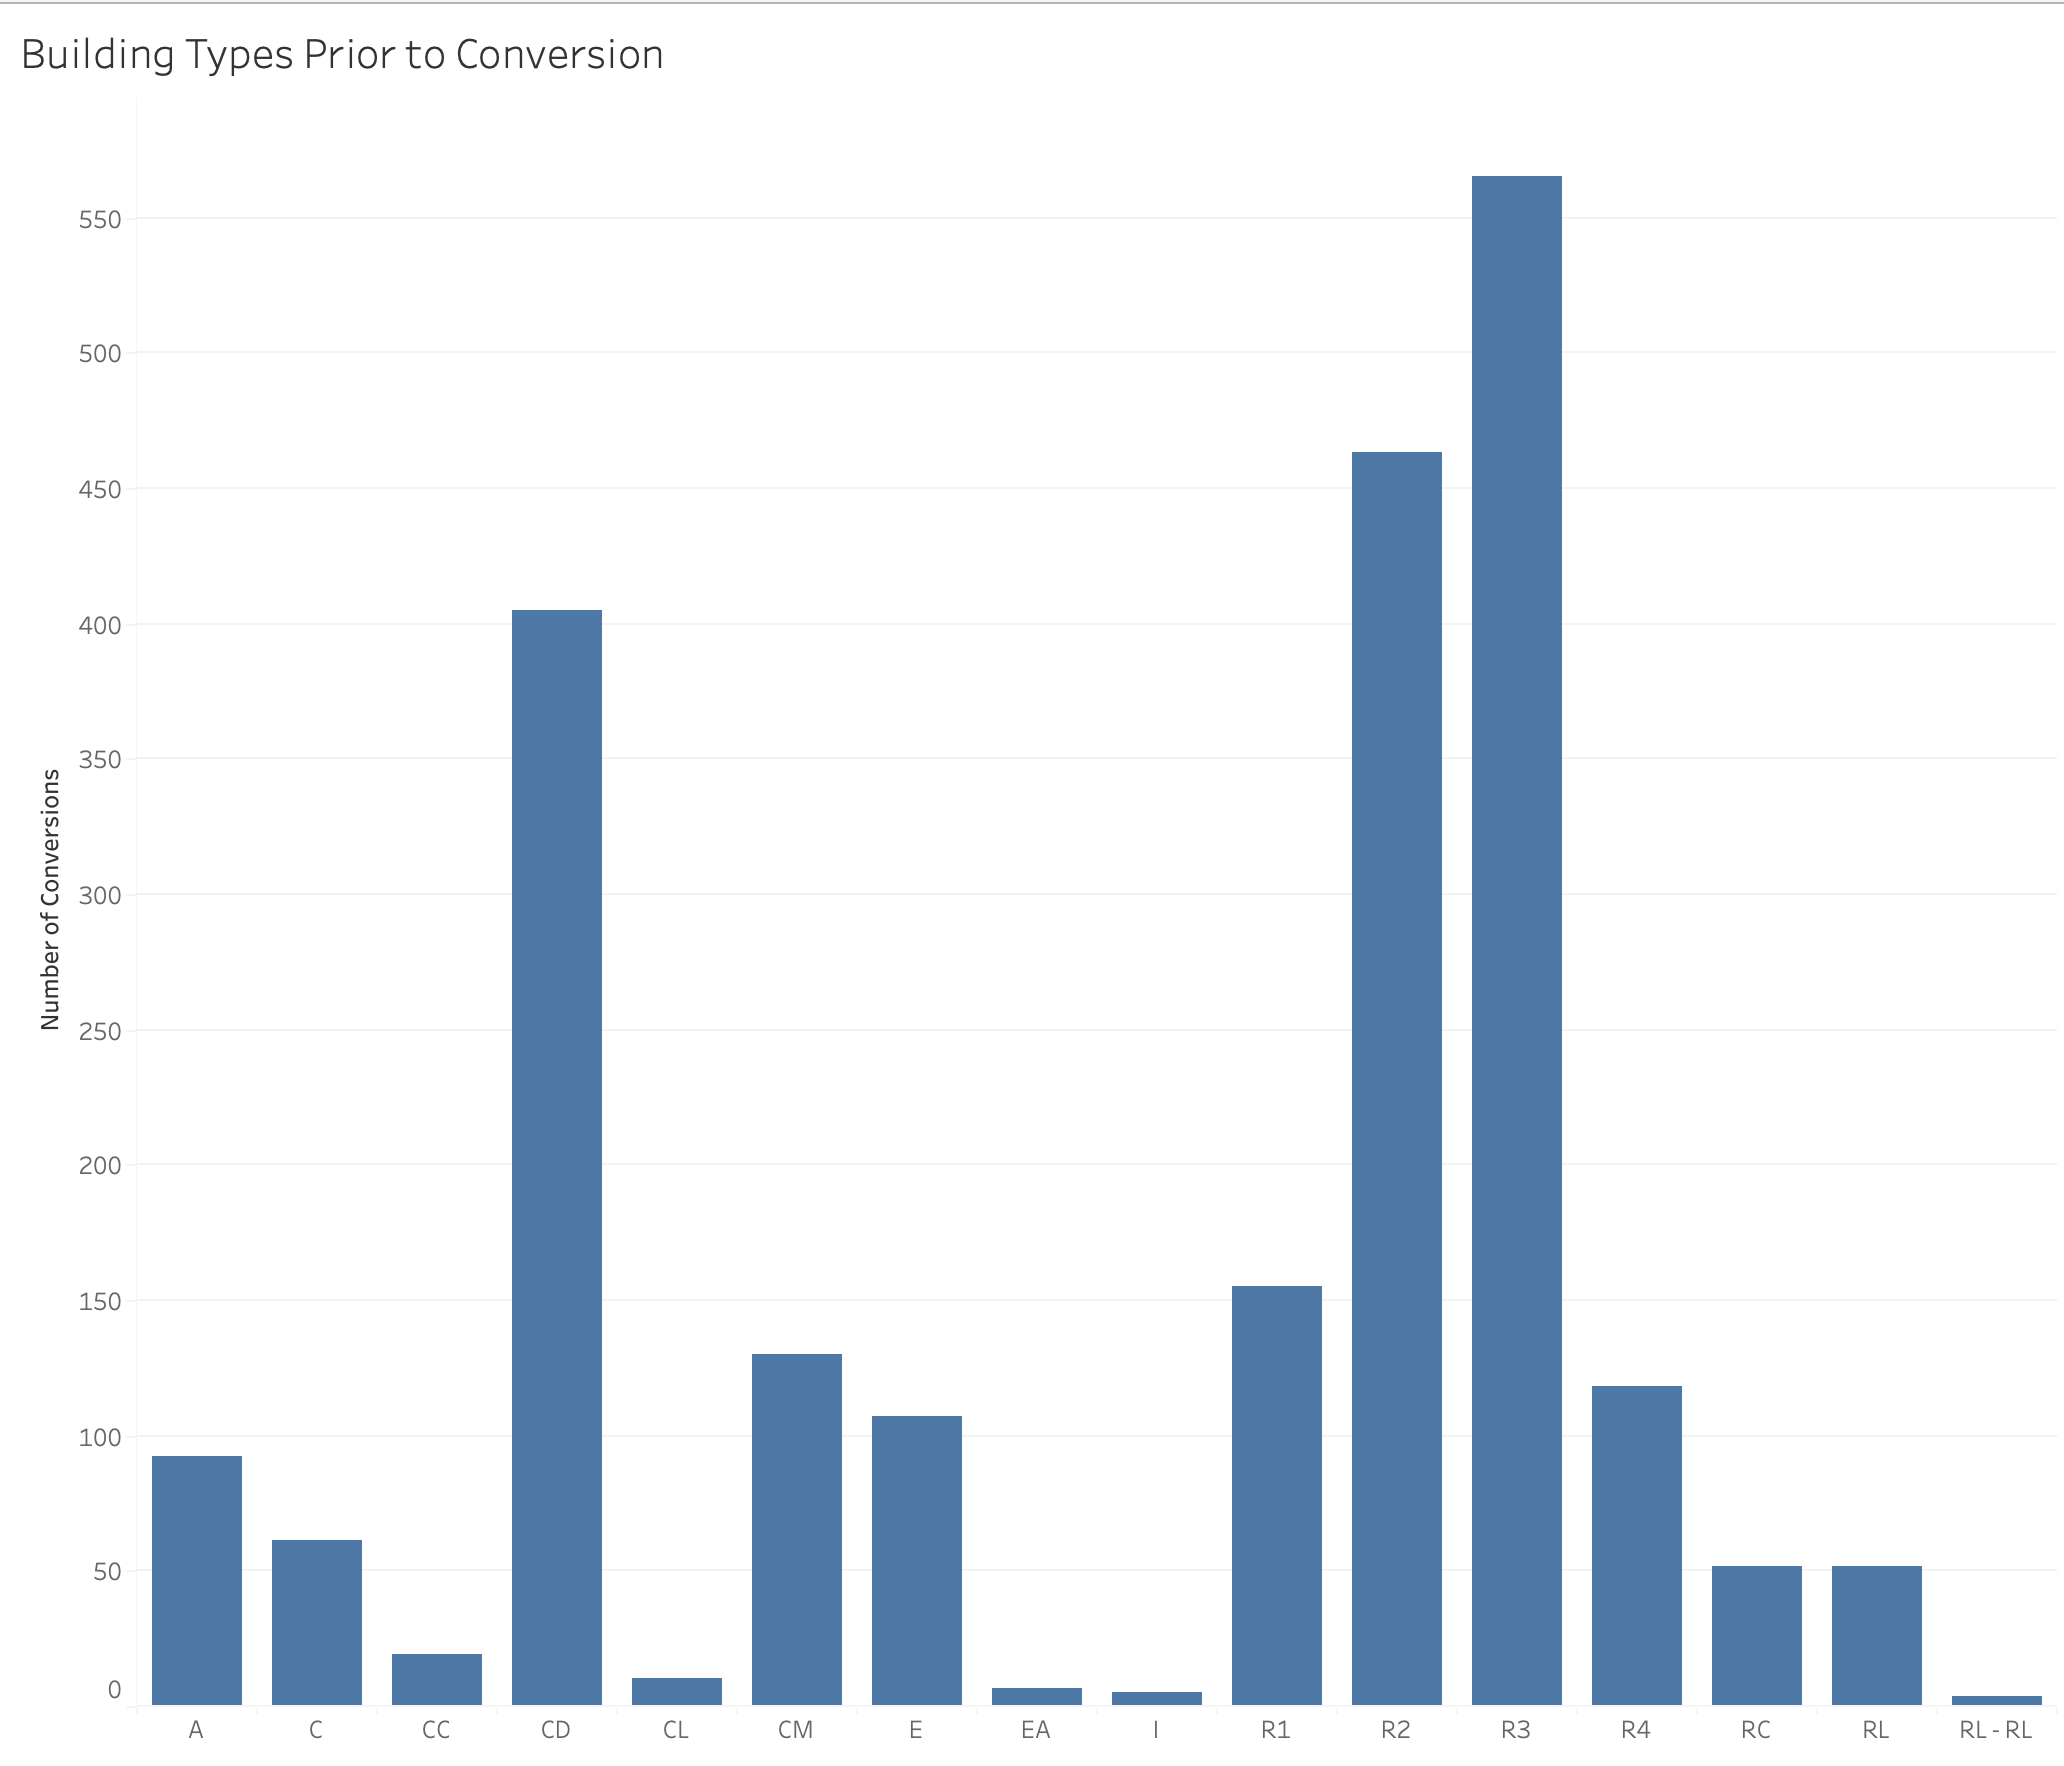
In the above figure, we see the spread of land use prior to conversion within the dataset. Residential land (R1, R2, R3) is the most prevalent followed by commerical. However, we notice there are some duplicates in the initial data with RL appearing a few times. Therefore, we must clean up this to fully analyse the impact. This part of the analysis will be conducted further in the first question deep dive.
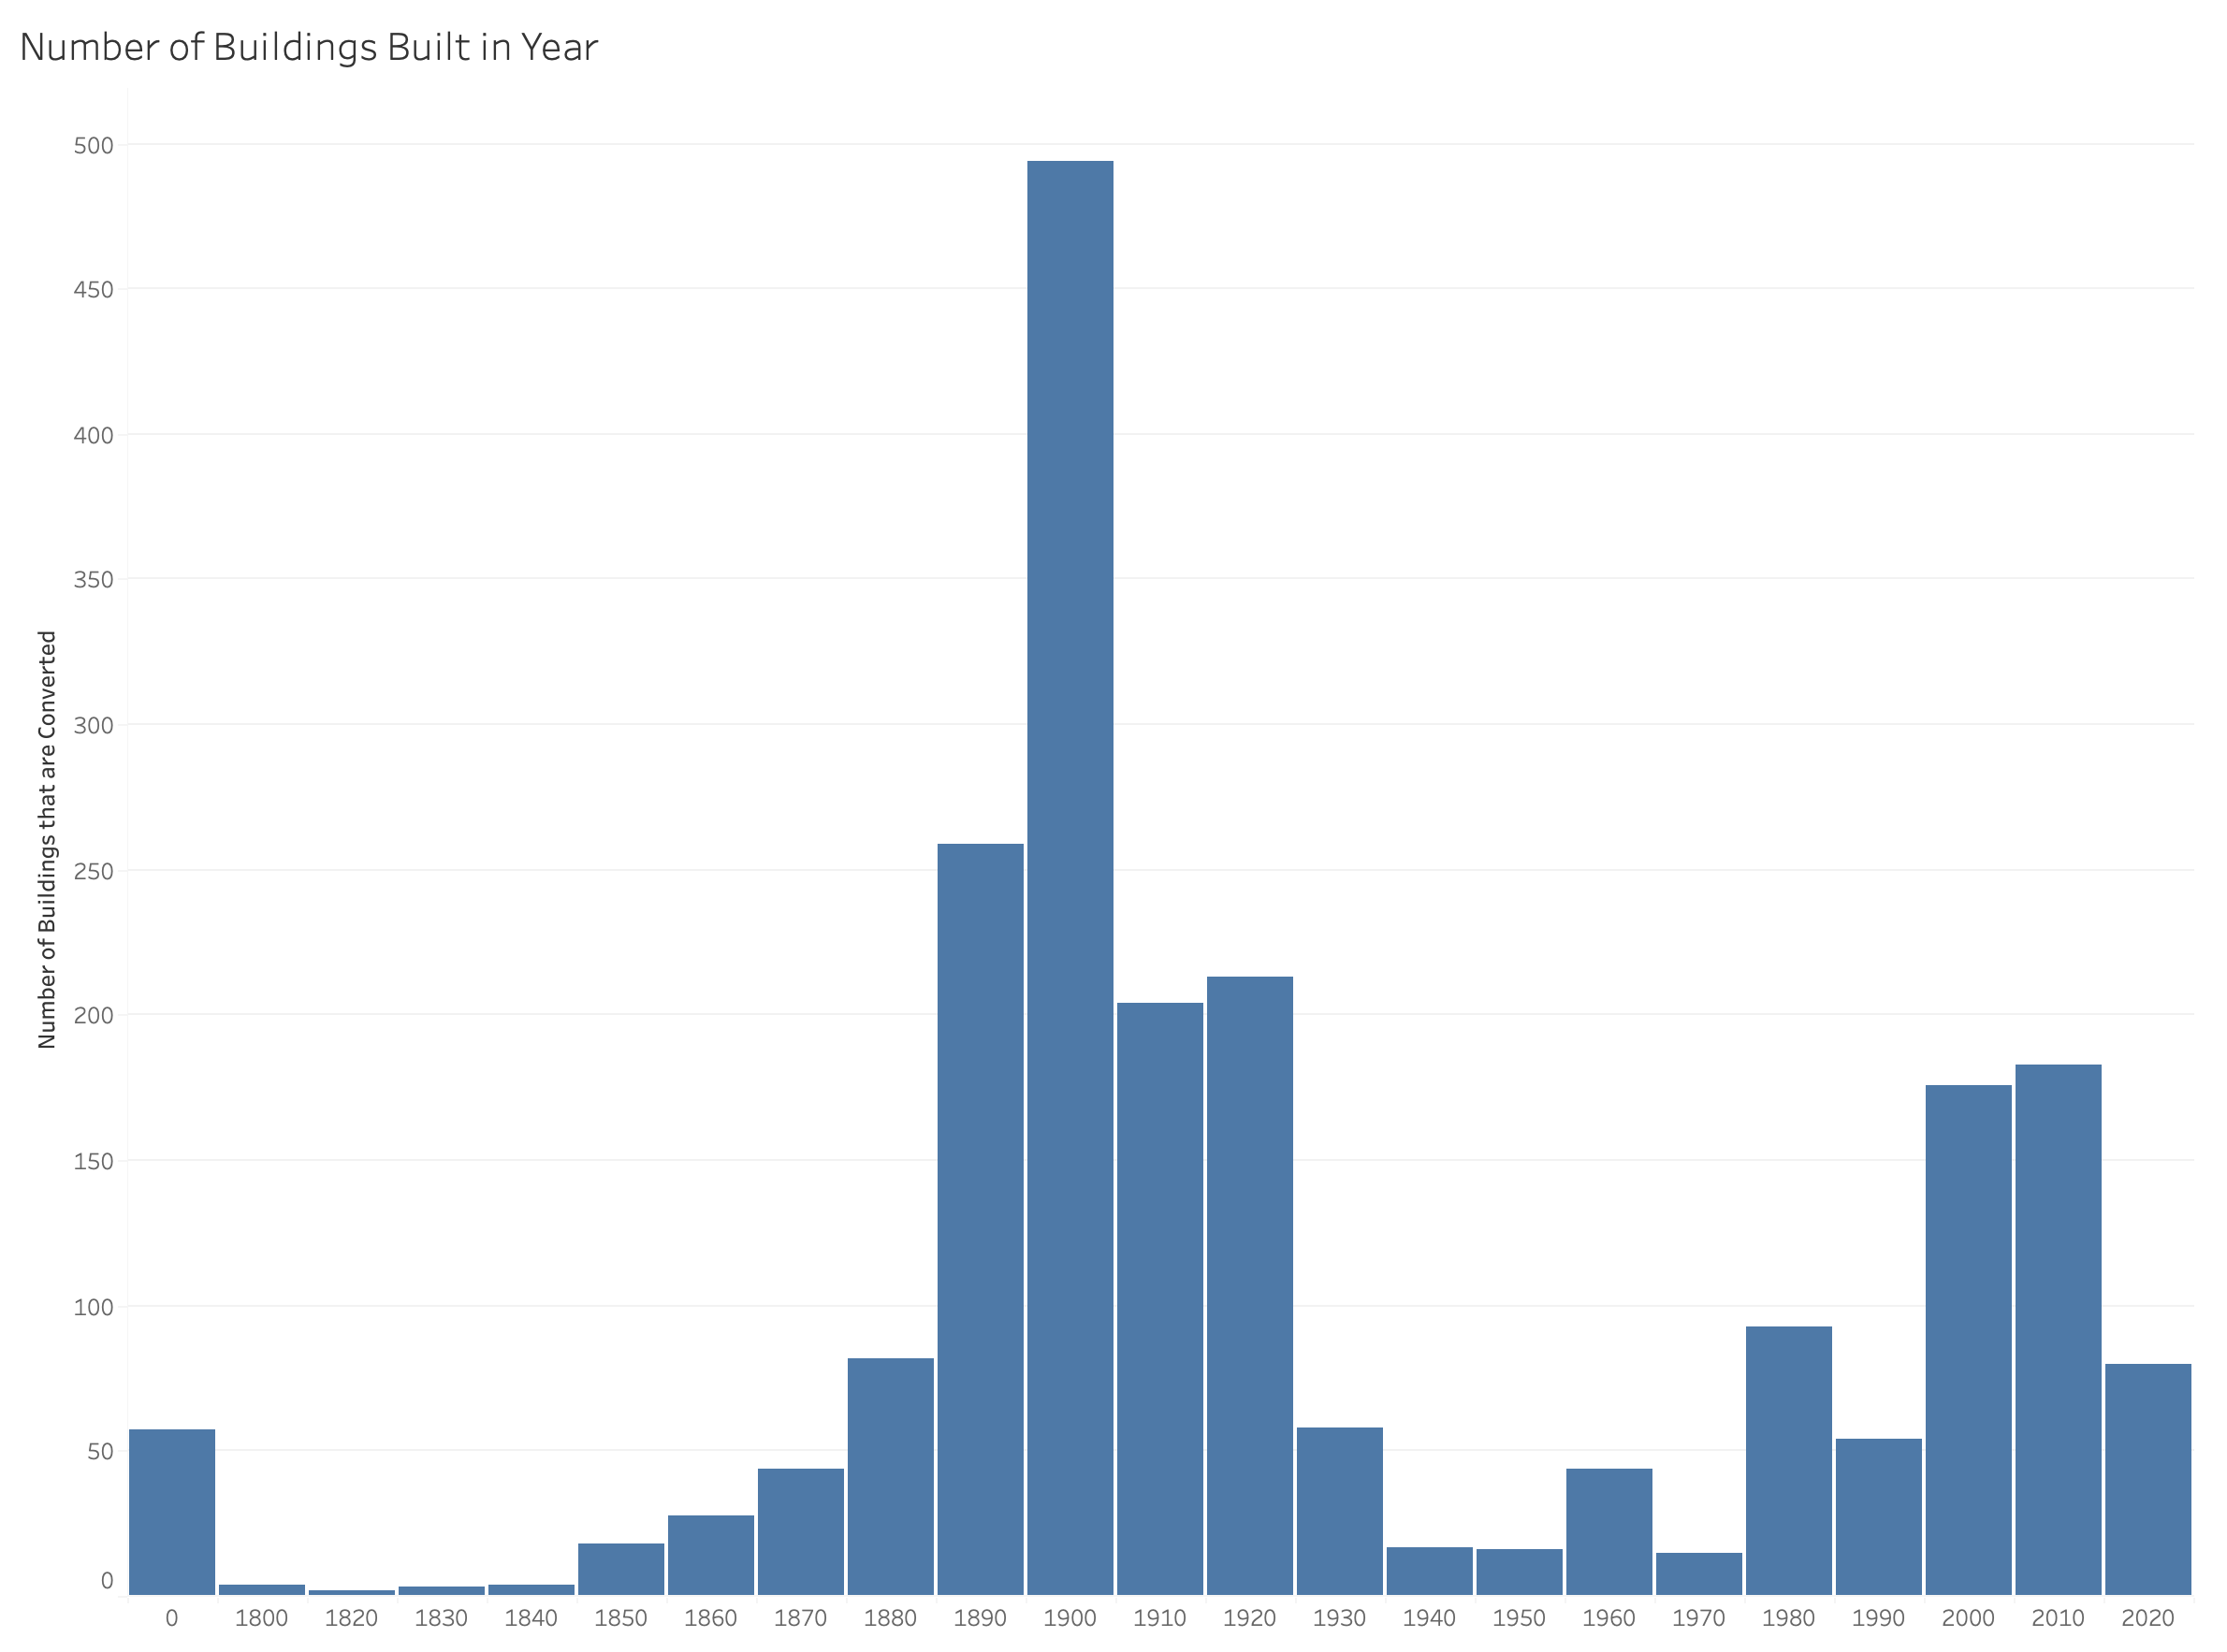
The above histogram is supposed to show a clean distribution of years. However, we notice that some of the years are denoted as "0". Currently, the data implies that some properties are built in year 0, but that may have just been a default value. Since this is not possible, it is clear that we need to clean the data to remove any data that has a year 0 when creating plots with the year built field. An analysis involving the year built will be further explored with question 1.
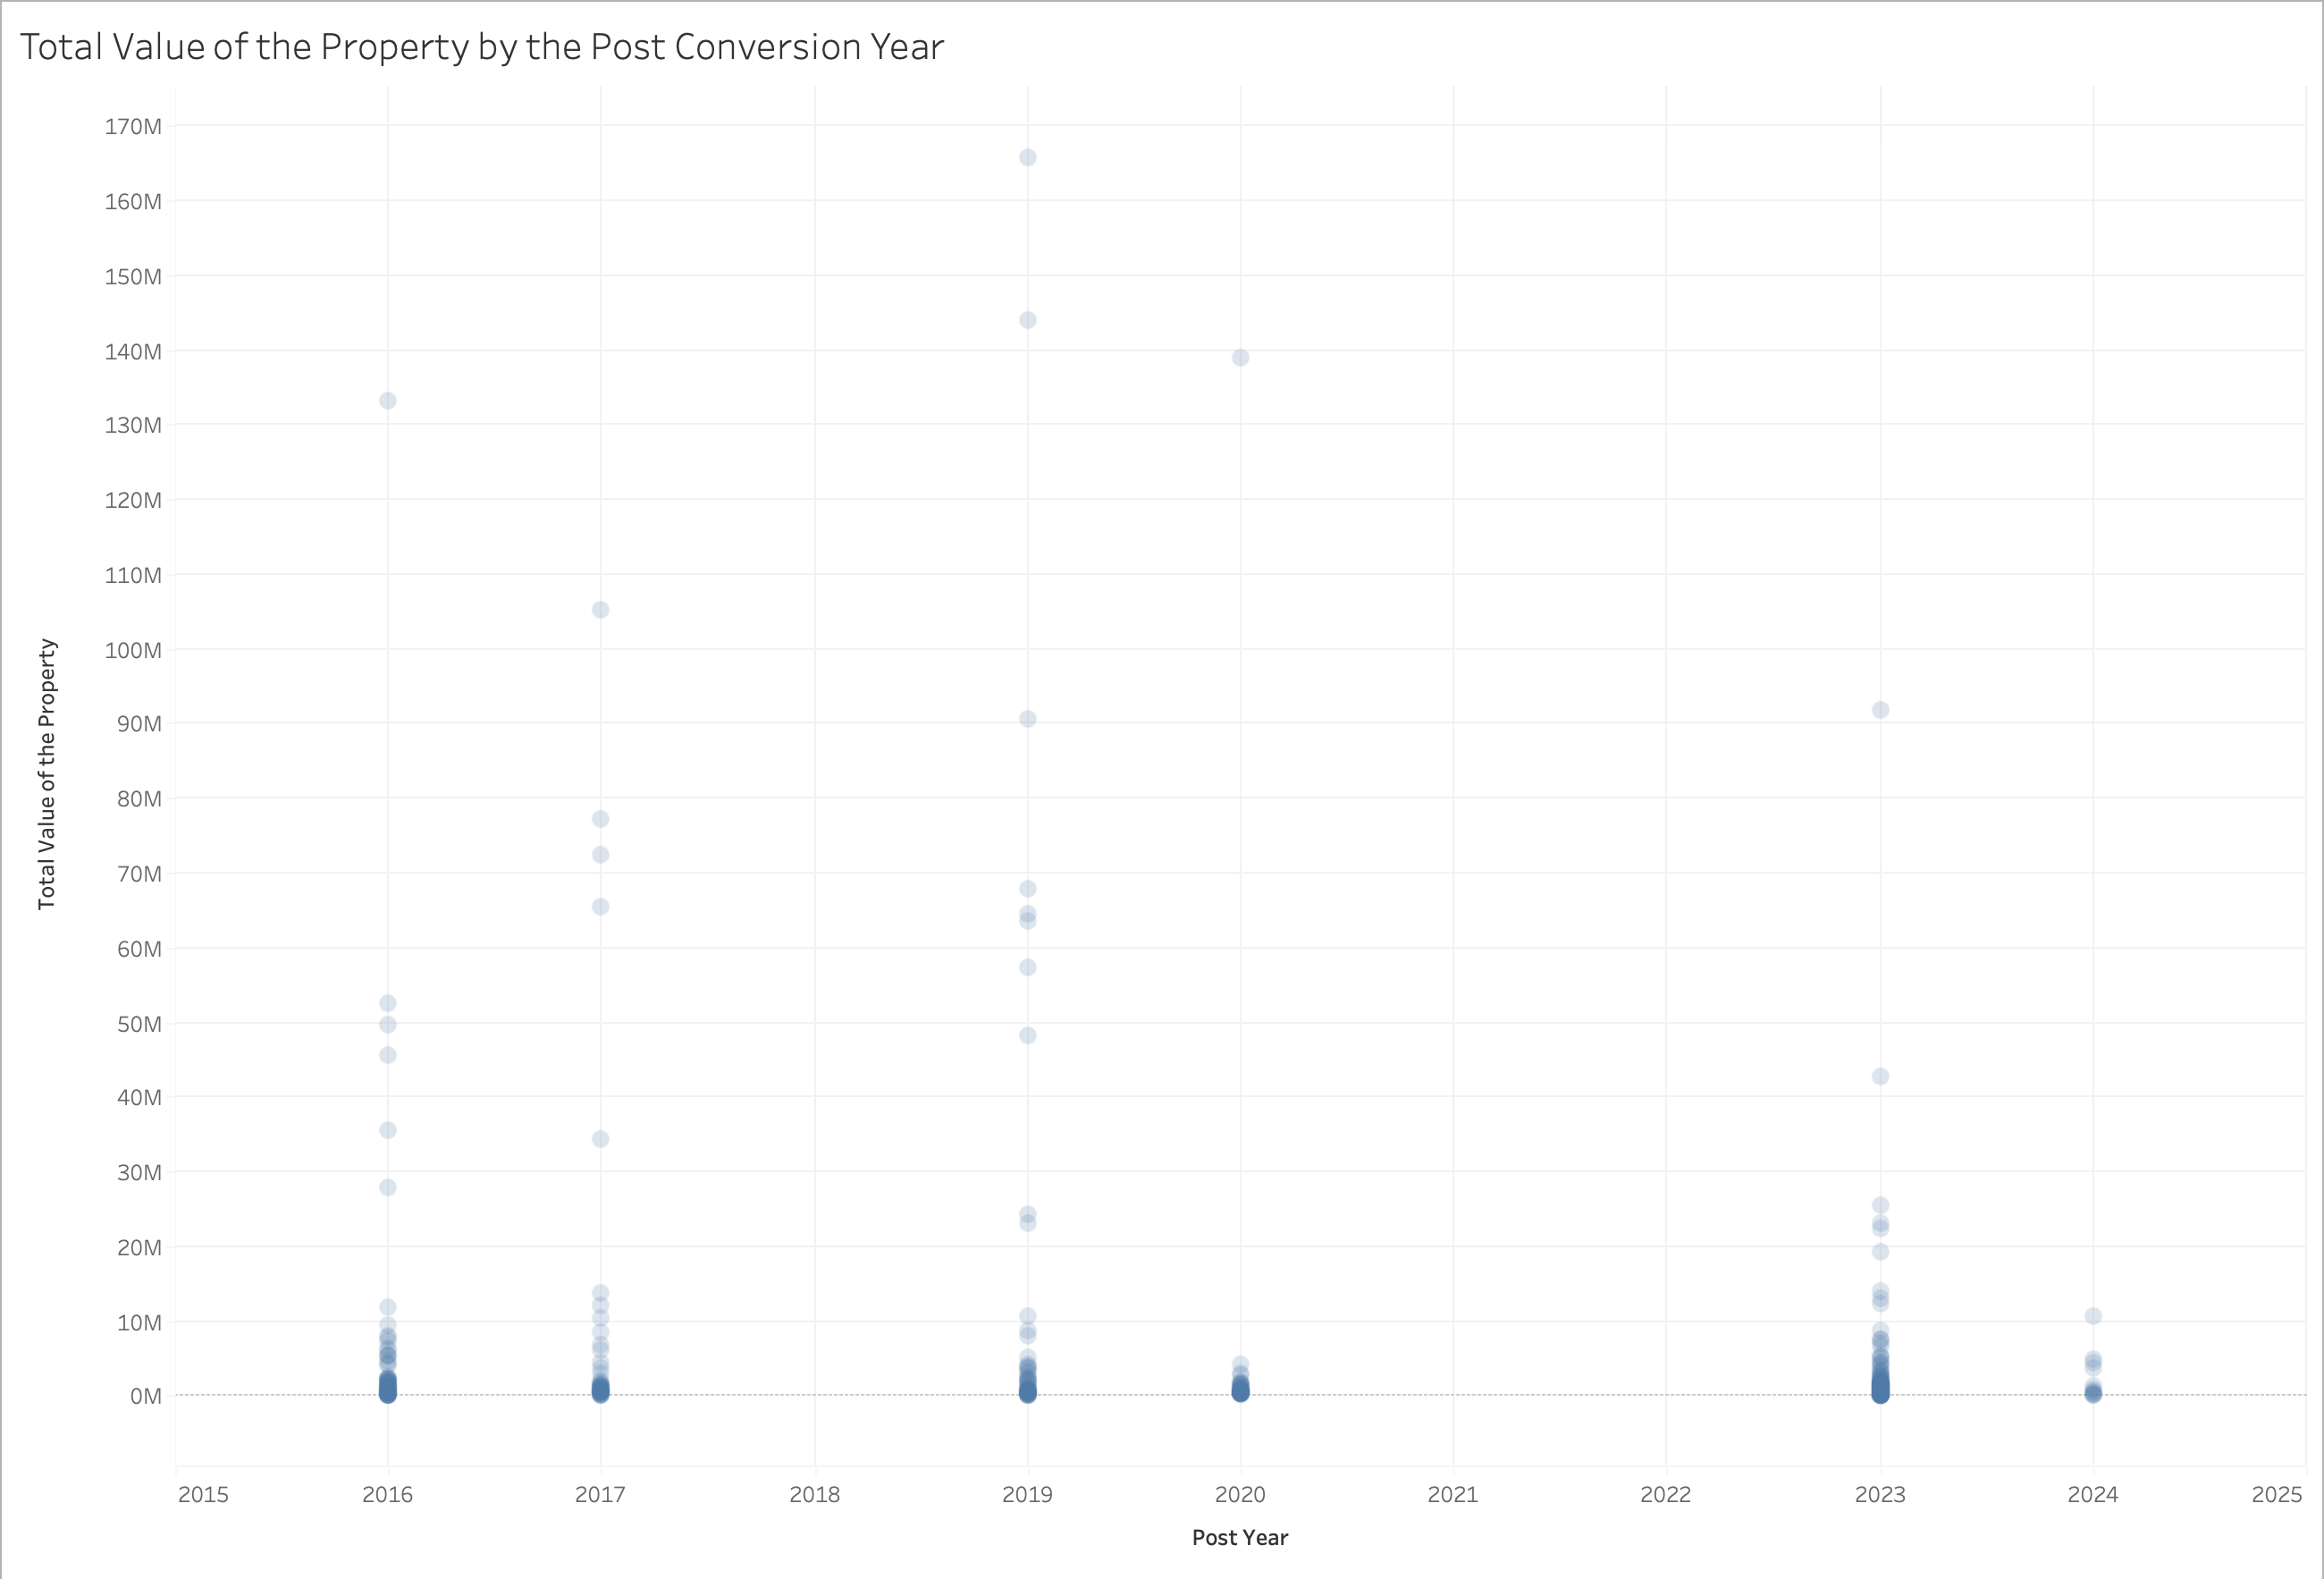
The above scatter chart helps to visualize the distribution of the post conversions and the total values of the properties. We find some initial insights that are quite interesting. First, there are several gaps in the data, as this dataset claims there were no post years in 2018, 2021, and 2022. Since there is no clear understanding as to why there is a lack of data, we examined the relationship between the prior and post years. Based on the data cleaning, all the prior years are the year of the conversion and the post year is plus one to the prior year. Additionally, it is interesting that most of property values cluster around the lower values of of $0M to $10M with a few substantial outliers approaching $150M. Furthermore, another interesting trend is the substantial decrease in value of projects started in 2020 and the lack of data in 2021 and 2022. It could be predicted that these occurrences could be caused by the COVID-19 pandemic.
What buildings are most likely to get converted?
We continue to hear in the news that many buildings are being converted into condos, but there is little information on which buildings are being targeted. This information is valuable to residents and business owners who are particularly fearful of a condo conversion. To explore these trends, a few key questions are being explored. First, is there a correlation between certain attributes about a building and the likelihood that it gets converted?
To investigate this, I first looked into what types of building are most prevalent prior to any conversion.
After cleaning up the duplicate labels, we compare the building types prior to the conversion and the building types post the conversion.
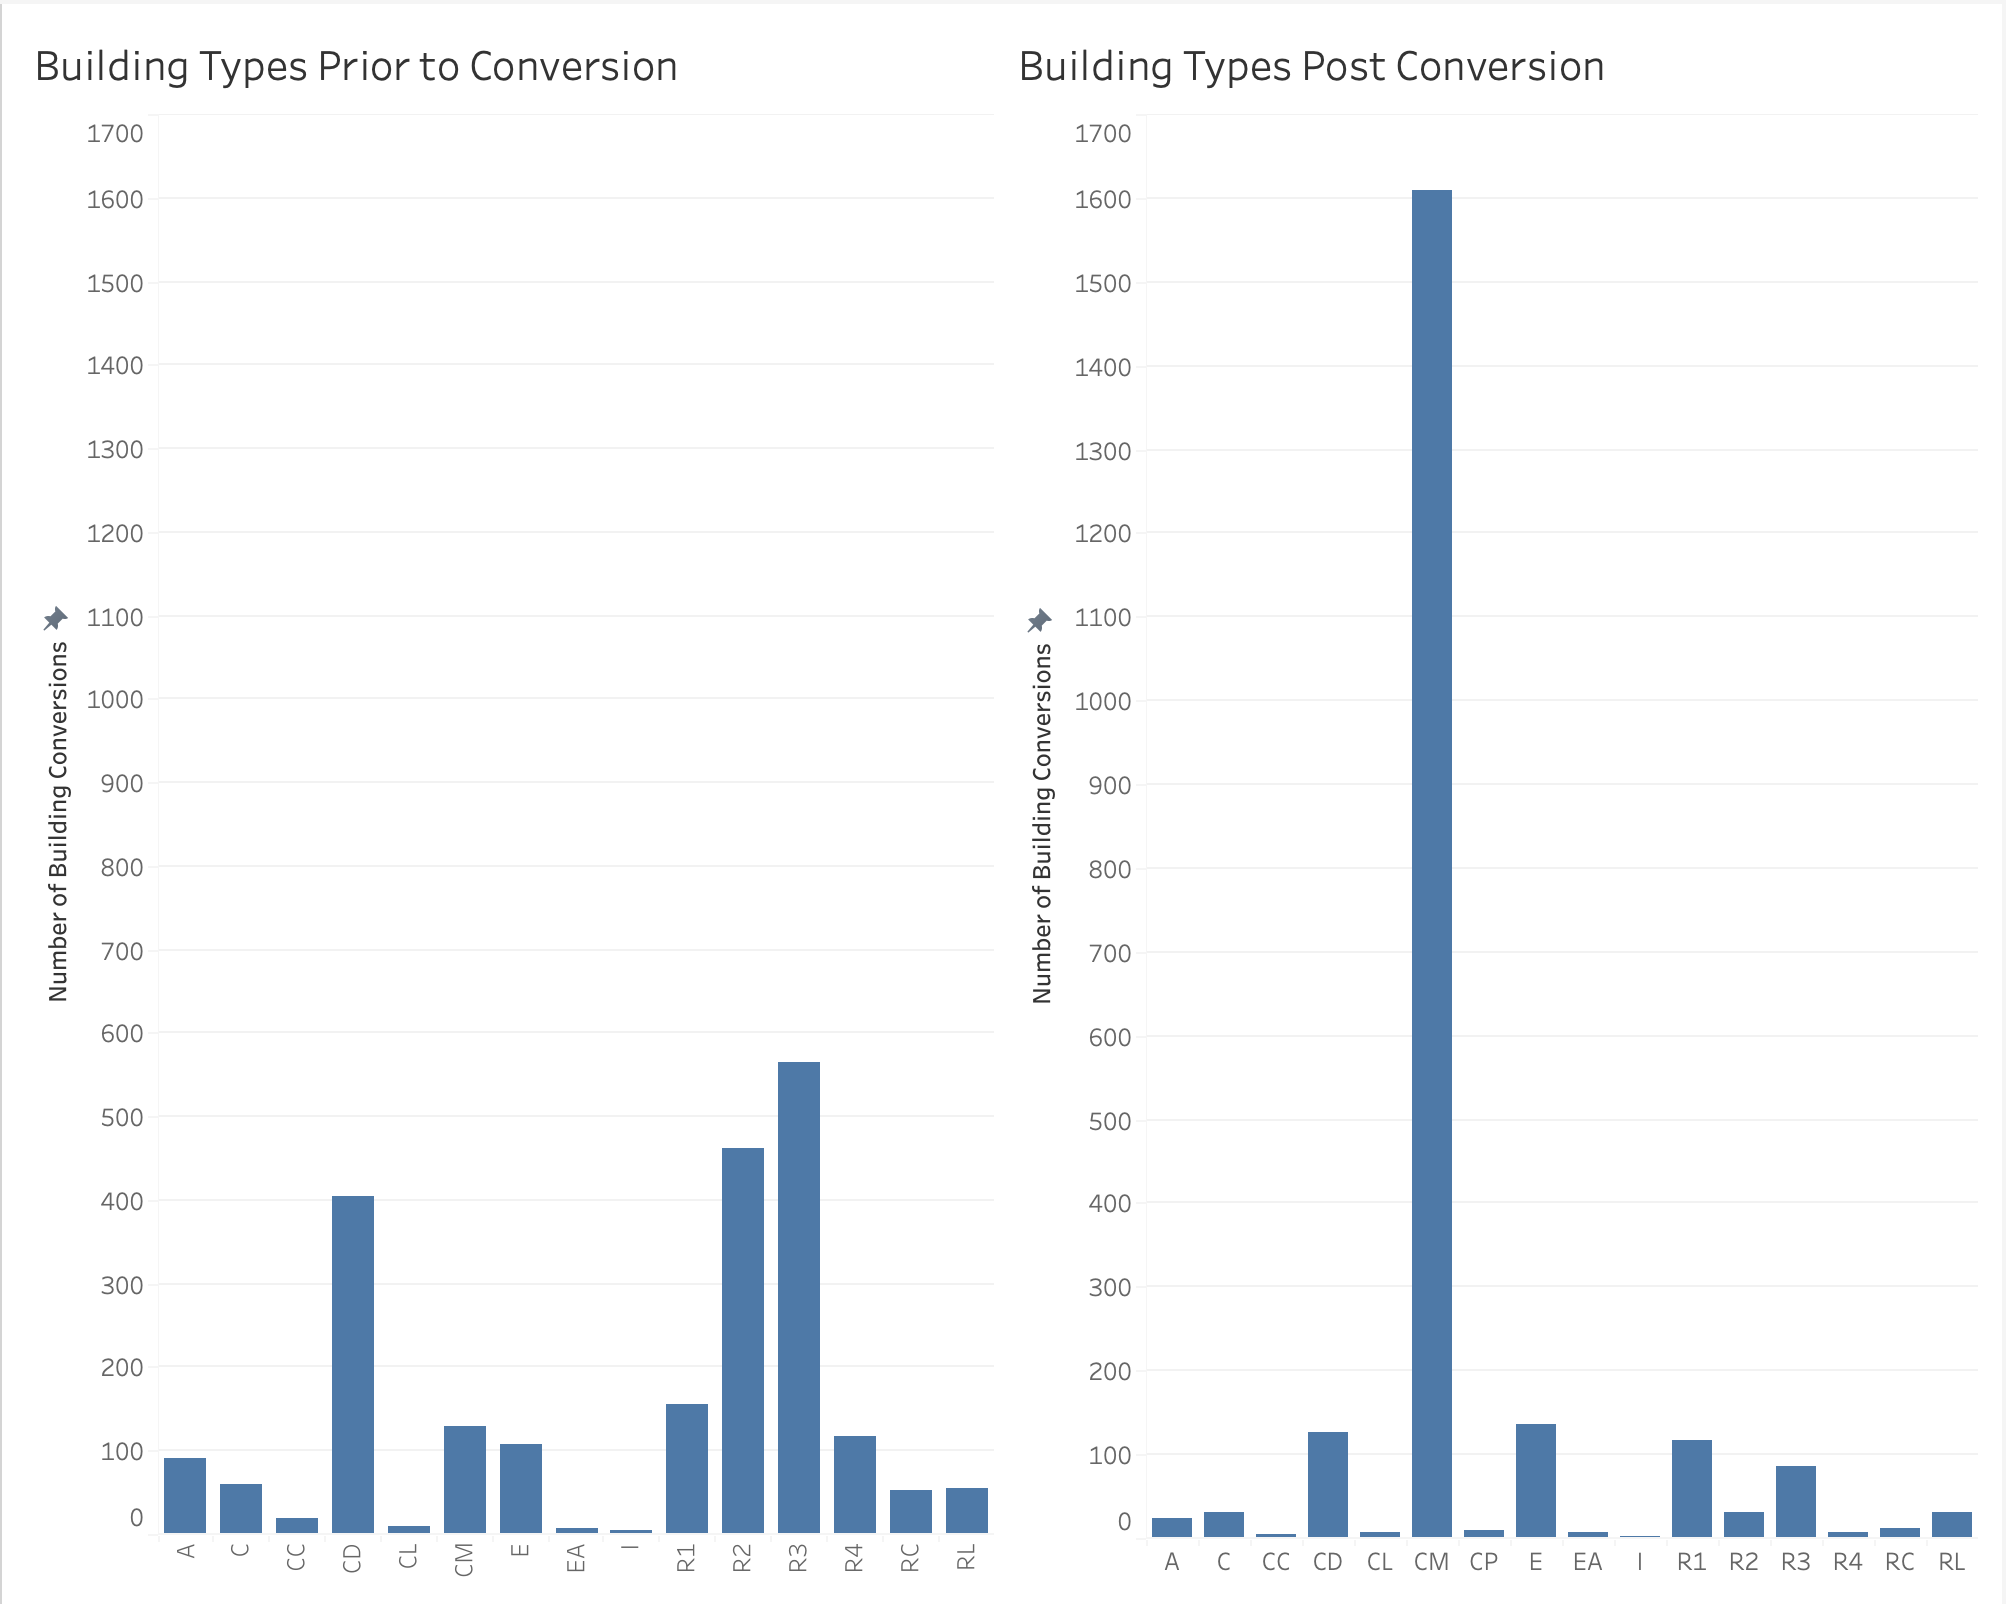
We instantly notice a sharp change in the distribution of the land use types. There is a great increase in condominiums after the conversions of the buildings and stark reduction in the number of residential units. Specifically, "CM" accounts for the majority of all the land use in Boston after the conversions, as per this dataset. Furthermore, a large portion of conversions are residential buildings with multiple families, suggesting many of these renters were faced with an impending housing crisis.
Seeing the total numbers before and after, I wonder what types of buildings are most likely to convert into other buildings?
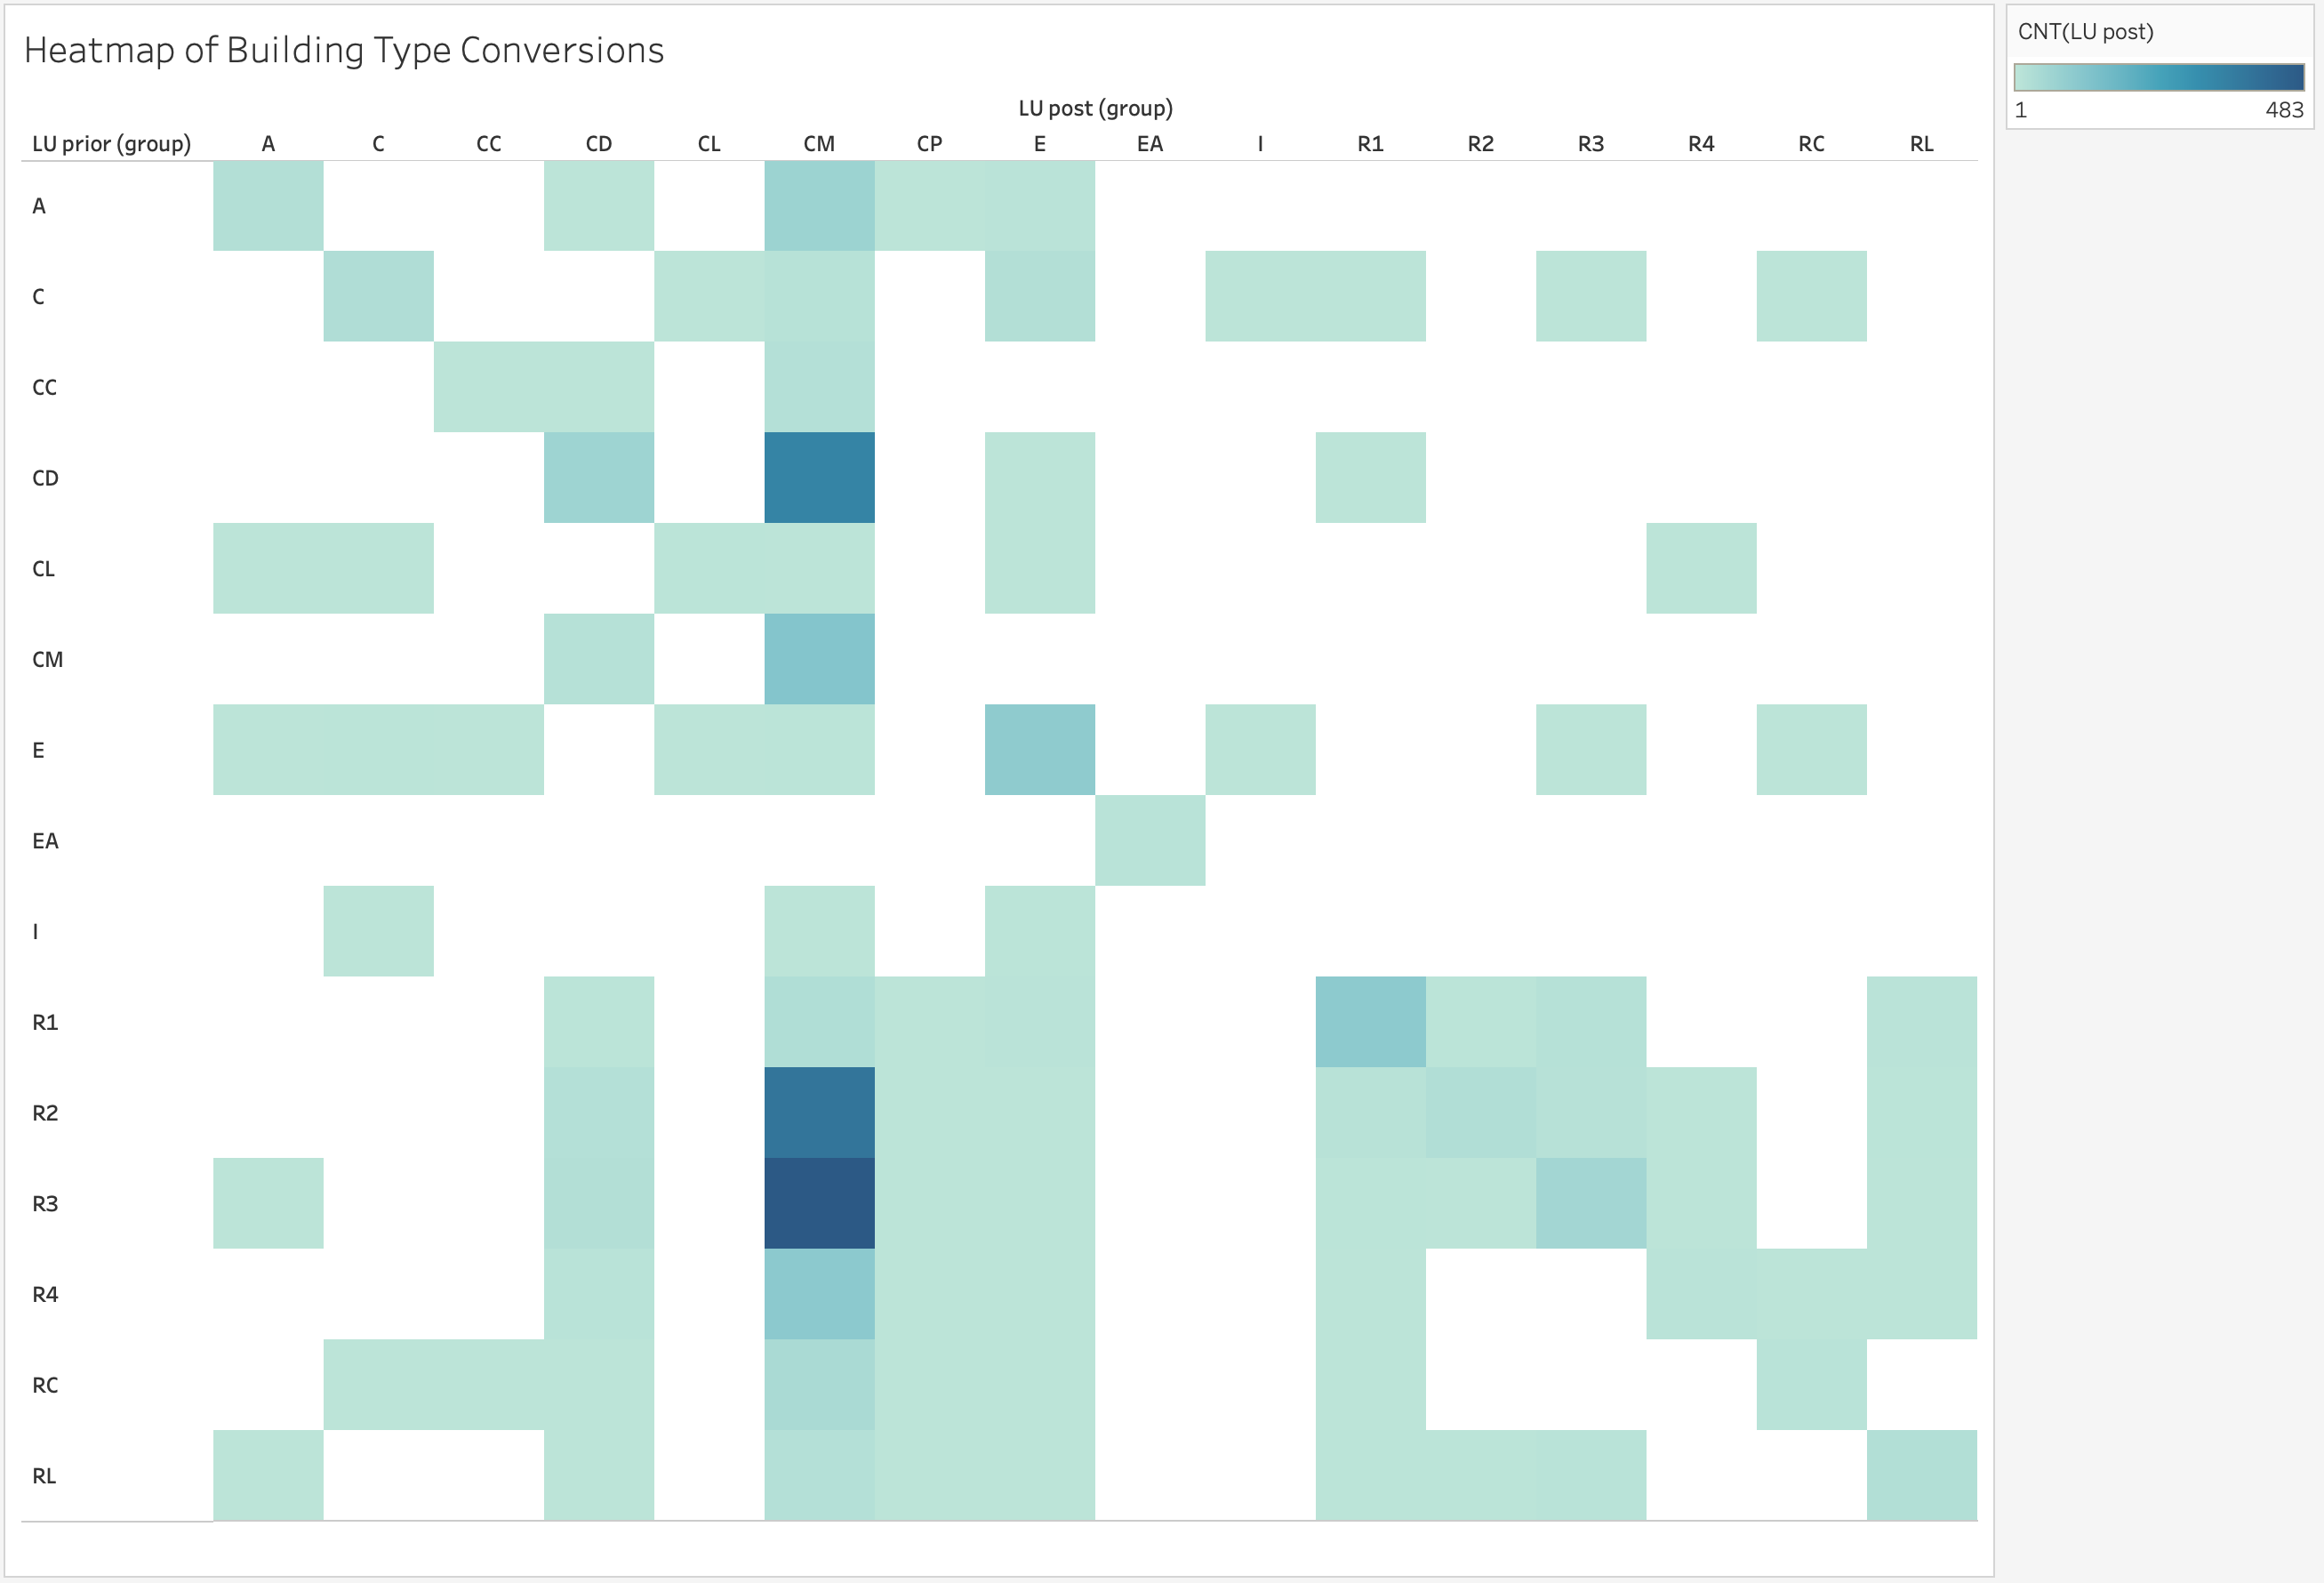
To visualize the prior and post land use label conversion, I generated a heatmap to explore the relationship between a building's function before and after a condo conversion. The heatmap indicates through the darkness of the color the number of property conversions of that type. In the heatmap, the "CM" column shows the greatest amount of activity with special attention from the residential land as expected(given the conversion is to a condo). One interesting observation is that a strong relationship was found between residential building containing one to two families and conversion to a condo. This effect suggests a higher probability of these buildings to be converted. We also notice that very few properties are converted to be tax exempt or residential.
At the same time, it is still quite difficult to understand what percentage of the "CM" conversions are attributed to each of the land use labels / property types. What buildings in particular are being converted to this type?
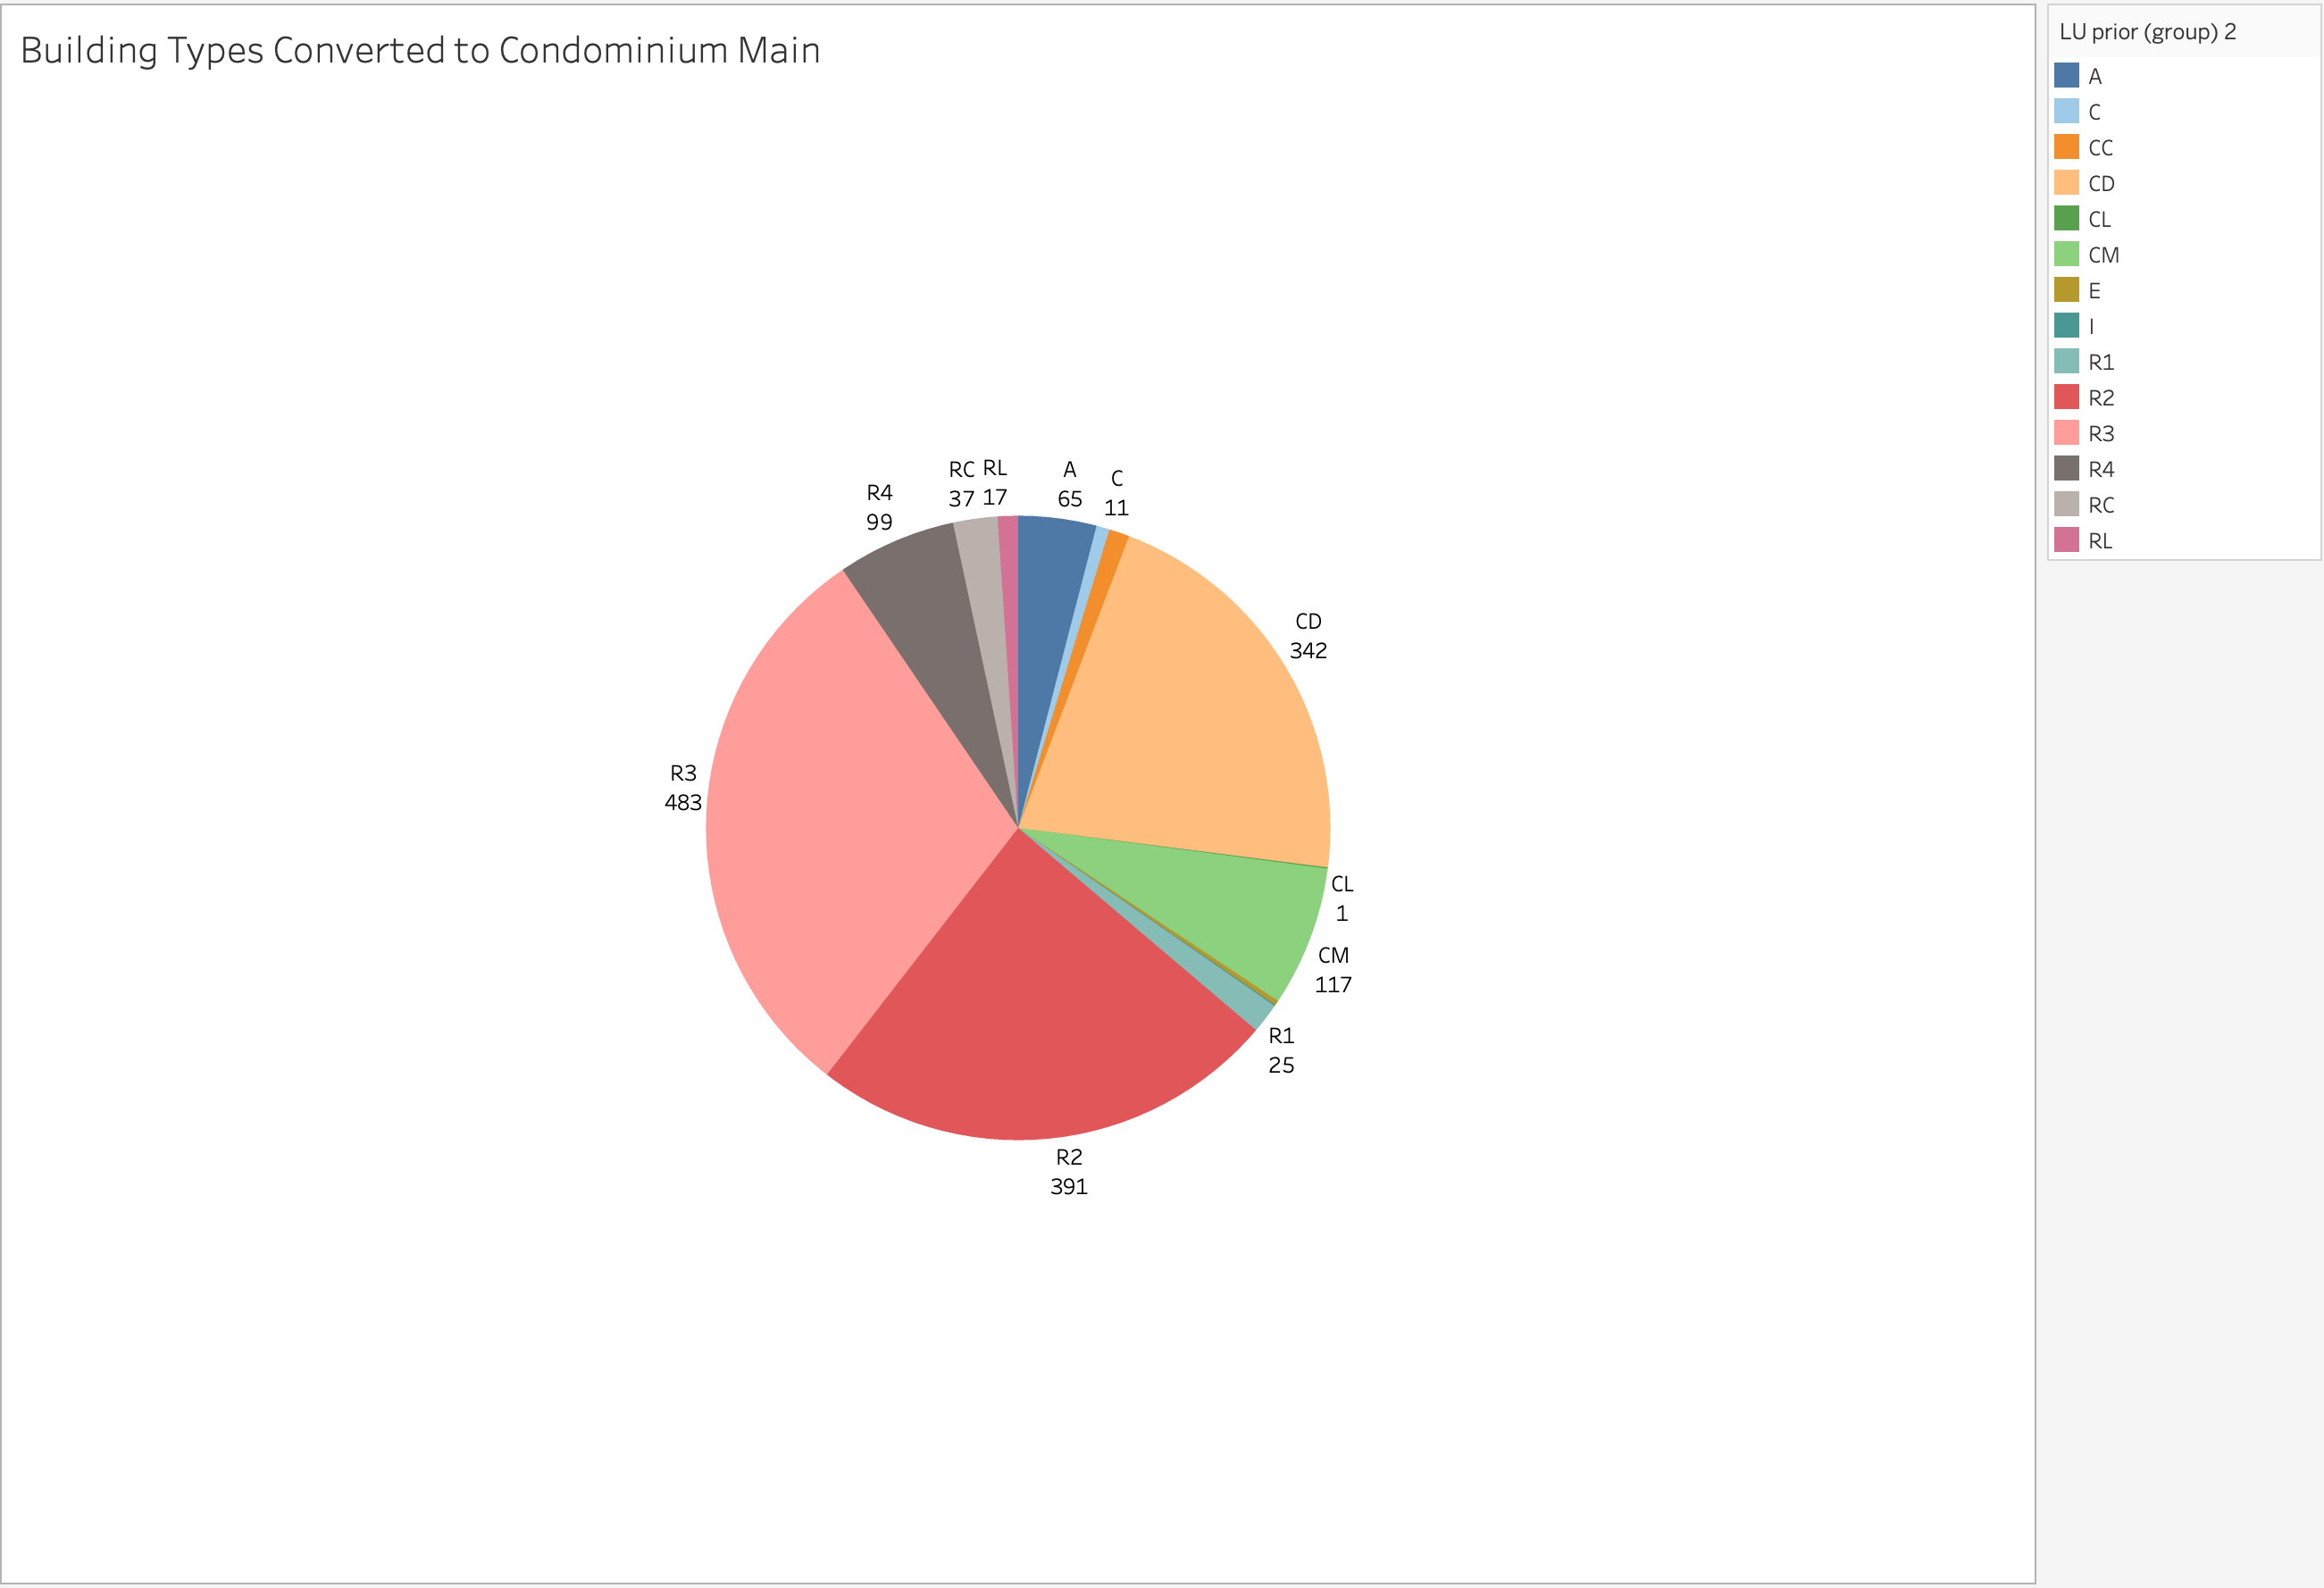
Confirming our suspicions from earlier, we can tell that the residential buildings, R2 and R3, really contributed to the CM land use type. It makes sense that 2-family and 3-family land was frequently converted into condominiums. Also, it was interesting that CD, another condominium type for residential condominiums, converted into CM as well. CM is the most general of the condos.
Beyond the building type, the year that the original building is built can also impact if there is a conversion. Though this is probably not the main motivation in converting a building, it could provide a little more insight into which buildings are seen as potentials for conversion. Prompted me to ask: what age buildings are typically being converted?
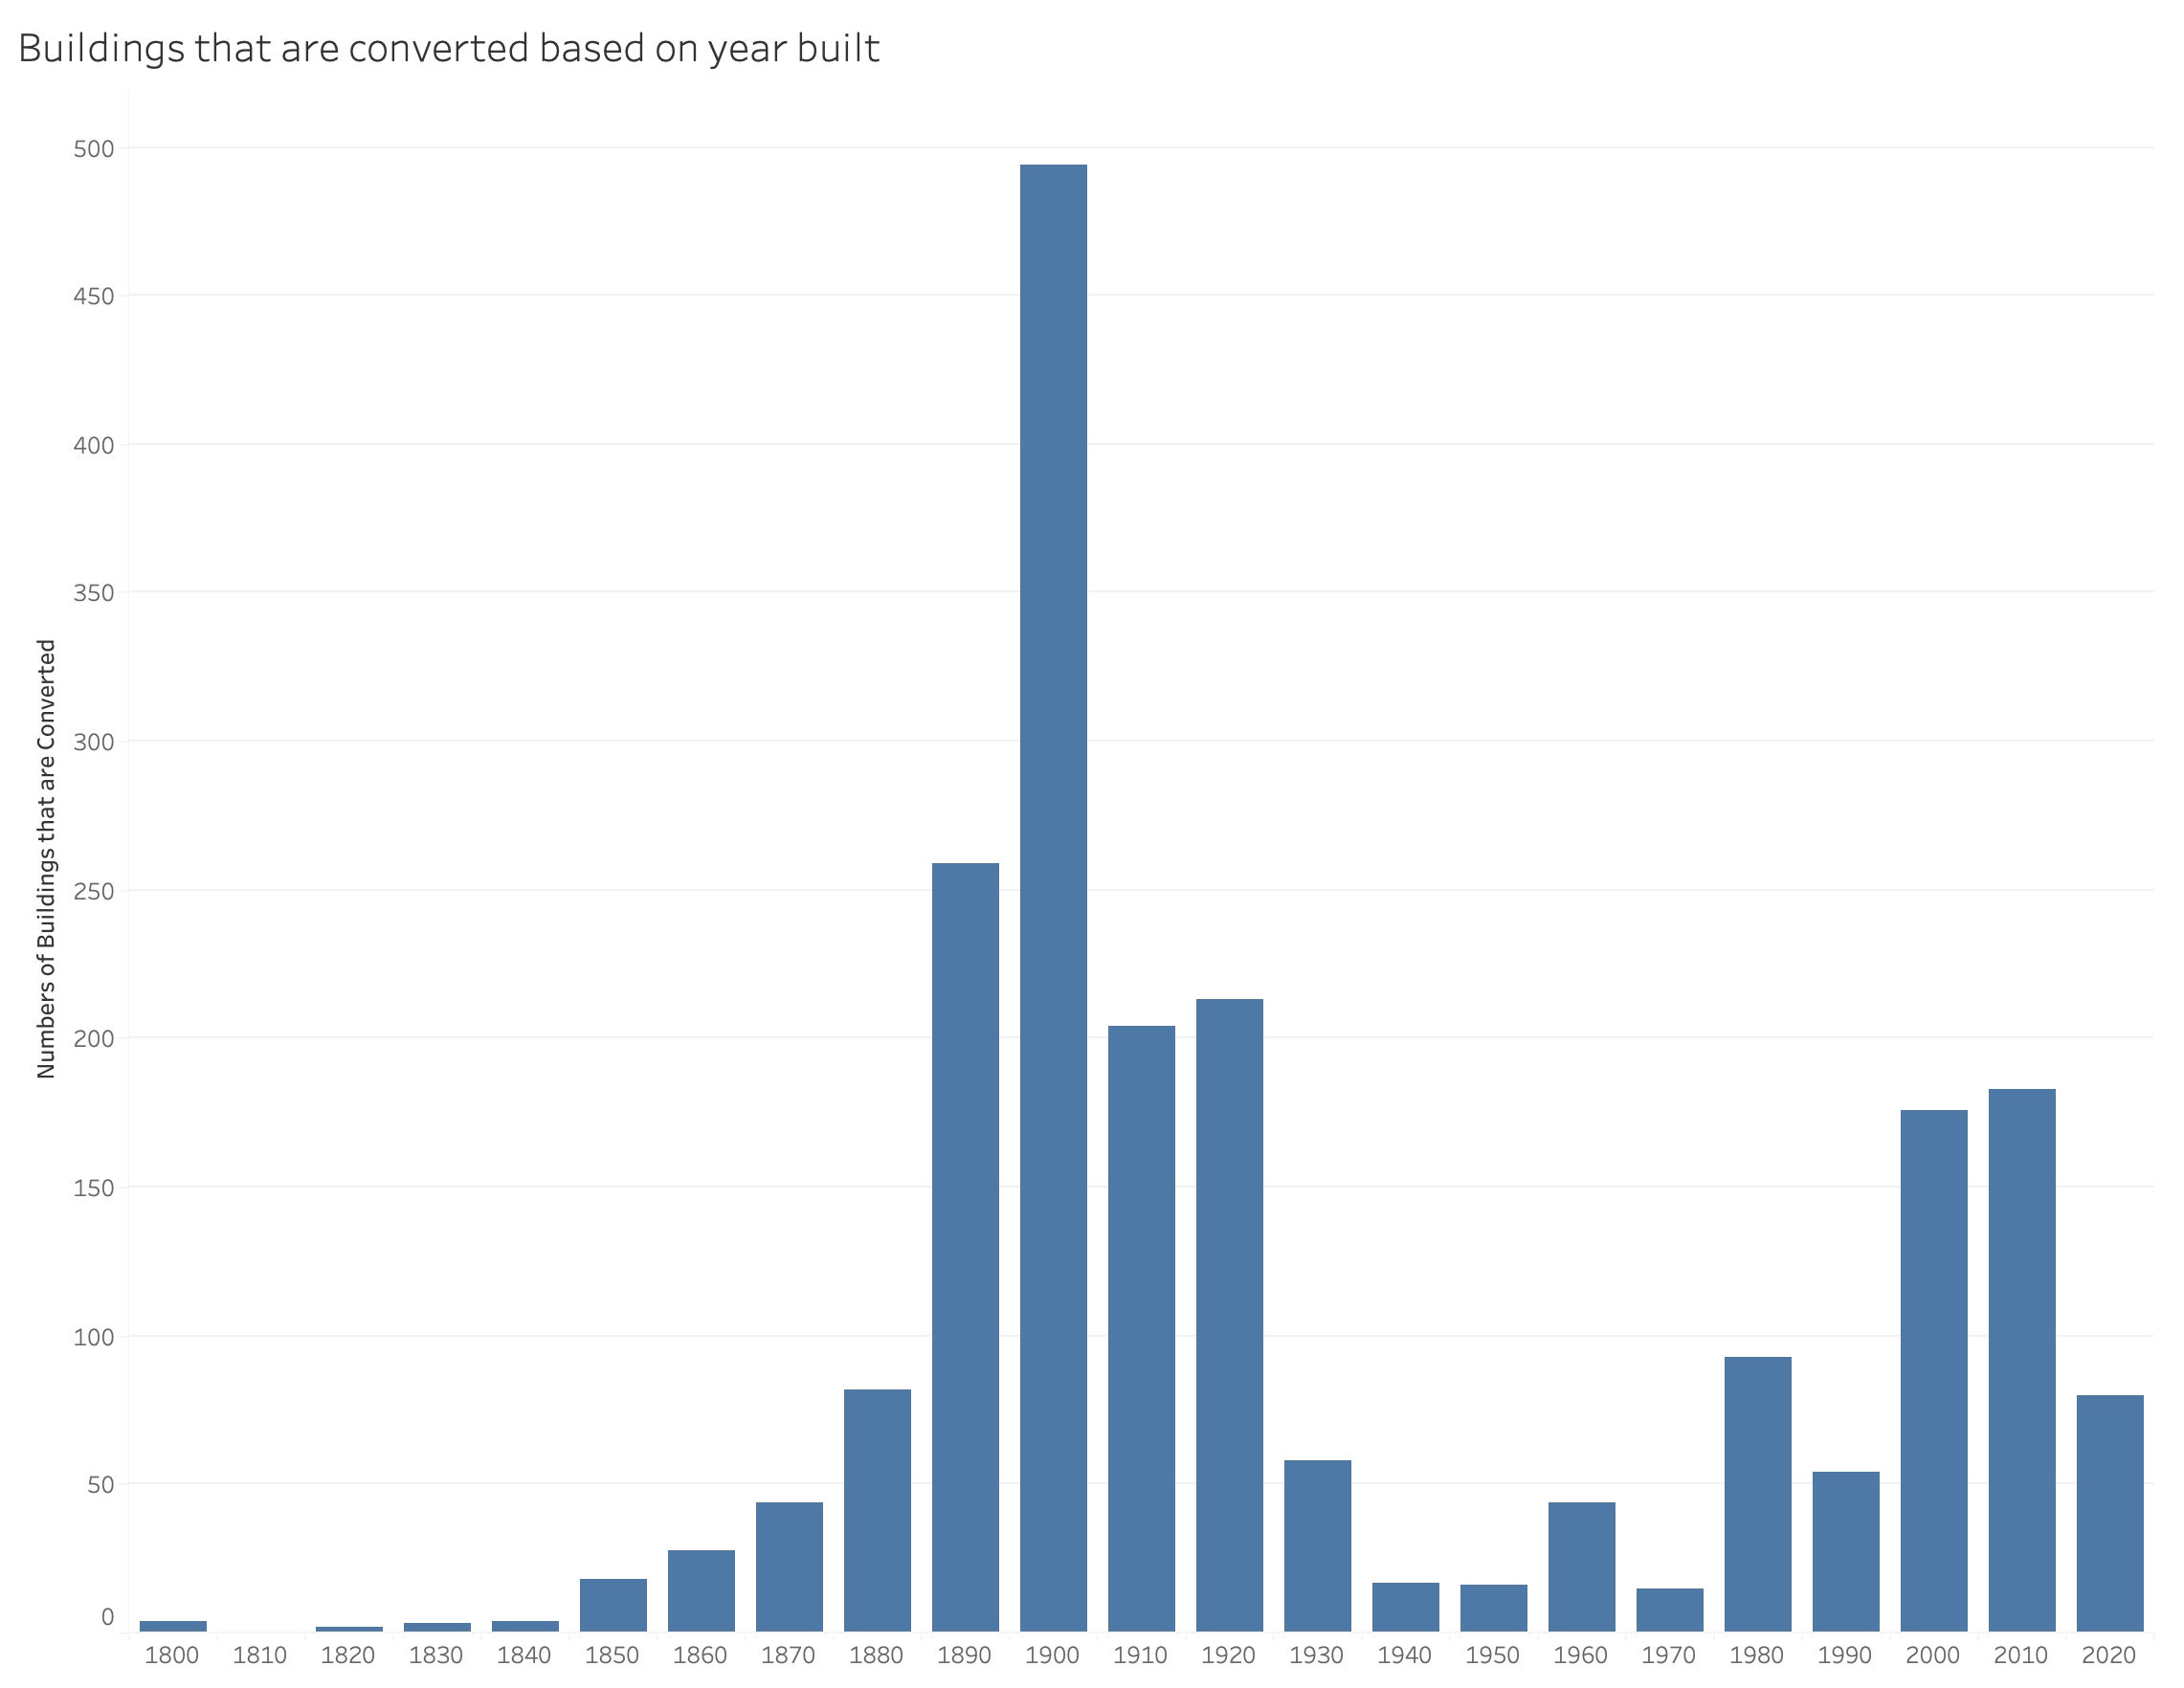
In our preliminary analysis, we constructed a very raw / initial histogram. However, in this revised version, we can see that most of the properties are built in 1900-1909. There are two peaks in the data: one around the early 1900s and one in 2010s. There is a clear decrease in the number of properties in the 1930s-1970s which can make sense with the Great Depression, World War II, and the Baby Boom of the 50s. Many families were seeking the "American Dream" and leaving big cities for the suburbs. While we cannot know for sure, there might not have been many buildings built during that time. Perhaps these trends are more emblematic of construction in Boston during different decades, than causes for conversion.
Through the analysis above, we have done a deep dive into the types of properties and the age of the properties are most likely to be converted.
Where do condo conversions happen in Boston?
Now, since we have seen the type of buildings or properties that undergo these conversions, there might be a correlation between the location of properties and the chance of the property having a conversion. As such, we analyze the different zipcodes and the number of conversions in each. These trends could suggest a pattern of socioeconomic influences, particularly driven by unequitable geographic distributions of wealth and development.
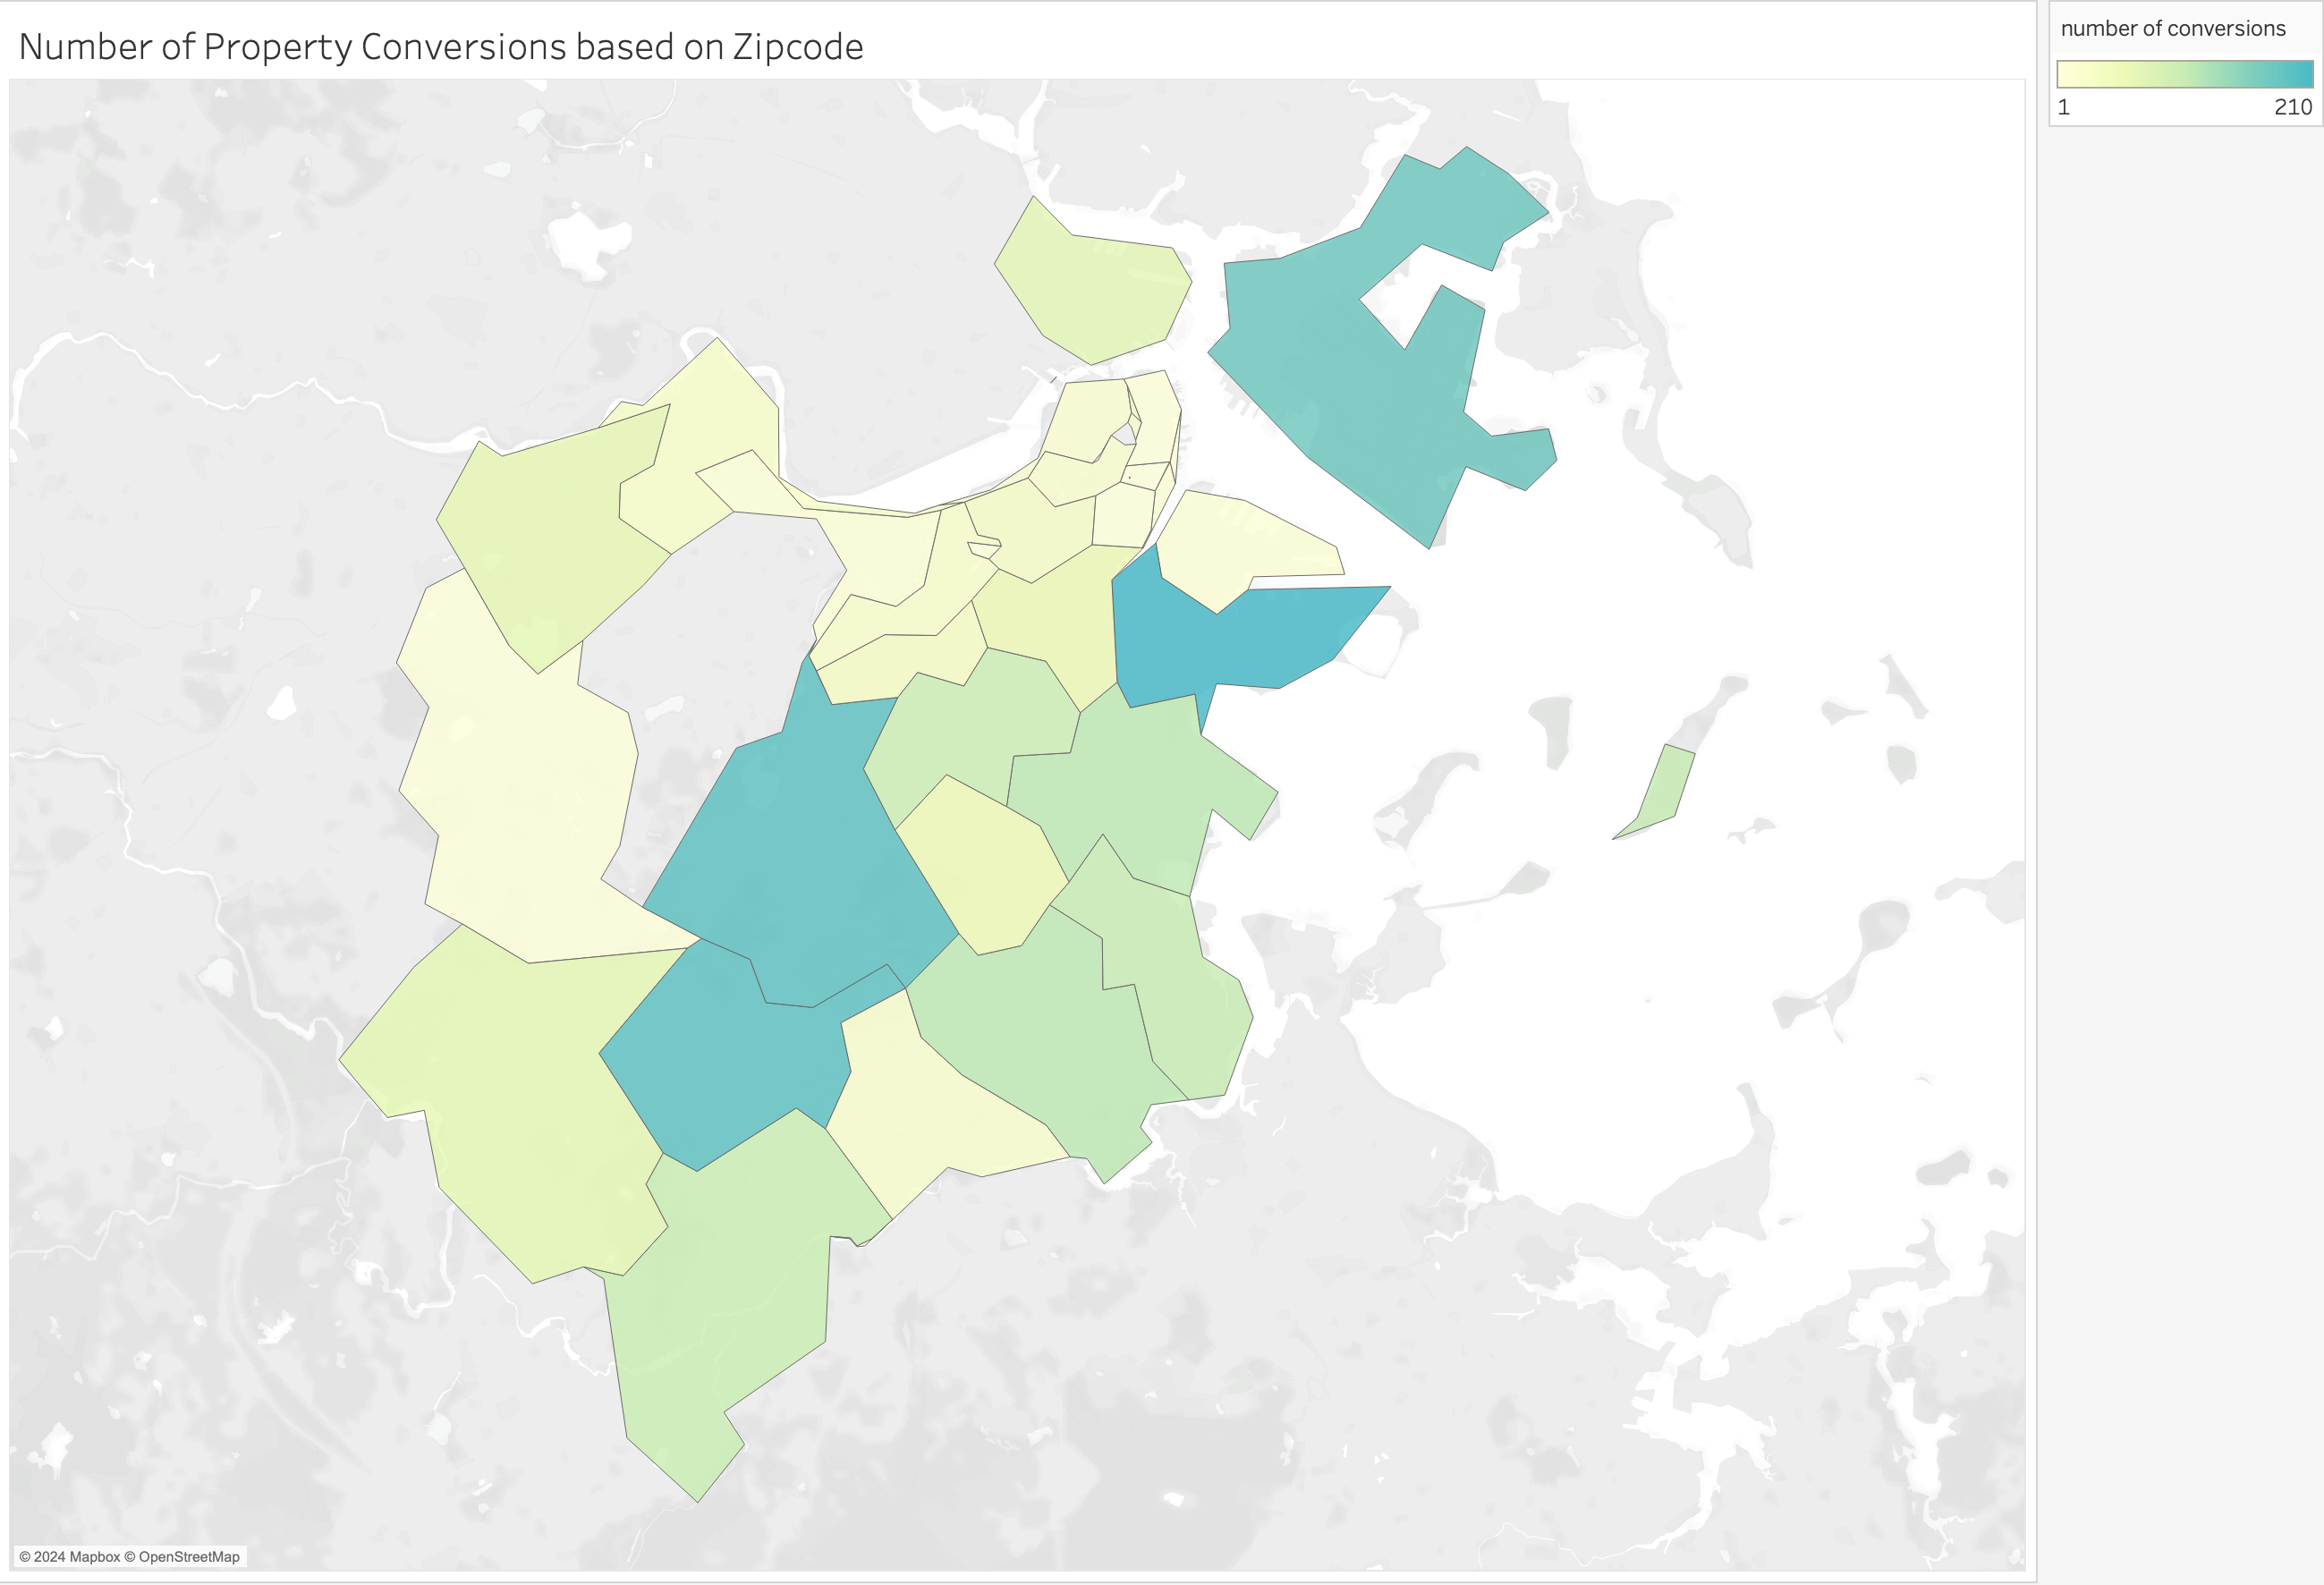
To create this visualization, we count the number of conversions or instances of the zipcodes that are present in the dataset. We notice that 02127, 02130, and 02131 have the most conversions. When these zipcodes are searched online for their demographics and their socioeconomic status, these areas are usually where you may find lower income households and cheaper housing. If this is true, this may imply that the conversions are taking place in areas that have more affordable housing. Further investigation needs to be done to help determine the validity of those claims.
I wonder how the city of Boston has changed from before the conversions to now? Specifically, how has the prevalence of certain land use types changed in Boston.
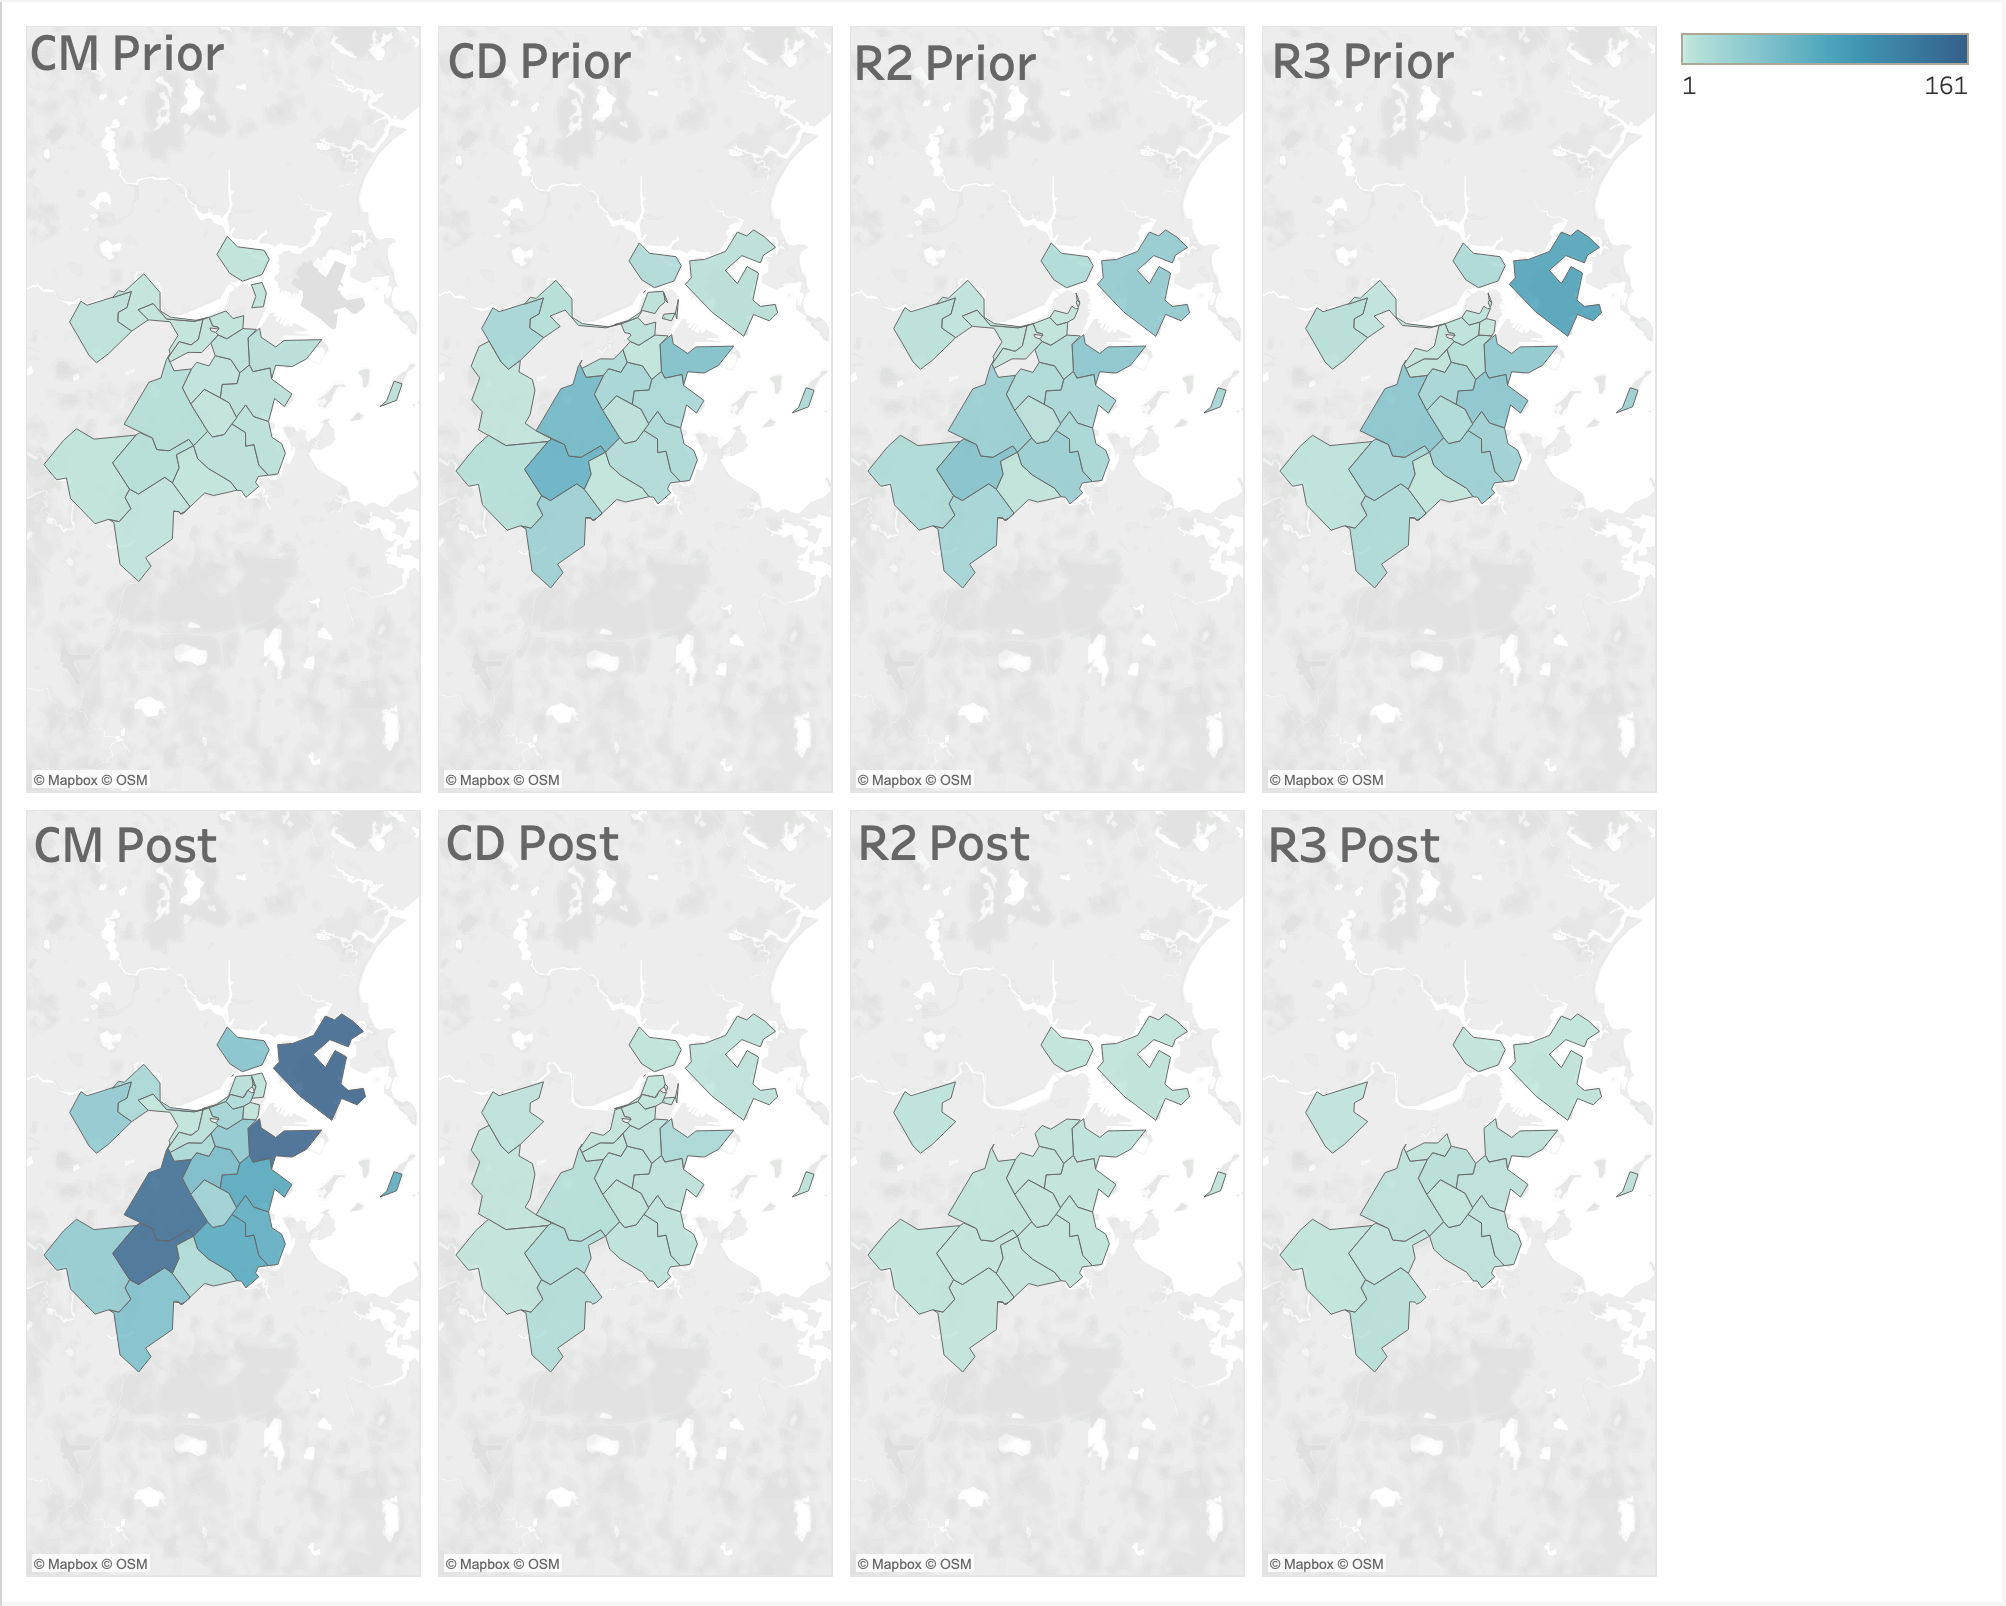
Earlier, we looked at the most prevalent land use types before and after the conversions. Taking the most prevalent categories (CM, CD, R2, R3), we create maps of the frequency of the property conversions to visualize the impact of the conversions. We can clearly see the decrease in residential living spaces around the Boston area, specifically through the maps in the right most columns, that can occupy two or three families. At the same time, it feels almost as CD, R2, and R3 priors combined together to create the post CM map. This indicates that the condominium creation or conversion has spanned the greater Boston area, removing the residential living spaces in place of condos.
Through the geography of the conversions, we have initial insights about conversions in low income areas and a larger reduction of residential places throughout Boston.
How does the value of property change?
Whenever you hear about condo conversions, it is usually associated with the motivation to make money. Consequently, it is quite fitting to take a look into how the valuation of various aspects of the property change after a conversion. This could provide insight into the motivation for many of these decisions while potentially suggesting the future state of these conversions.
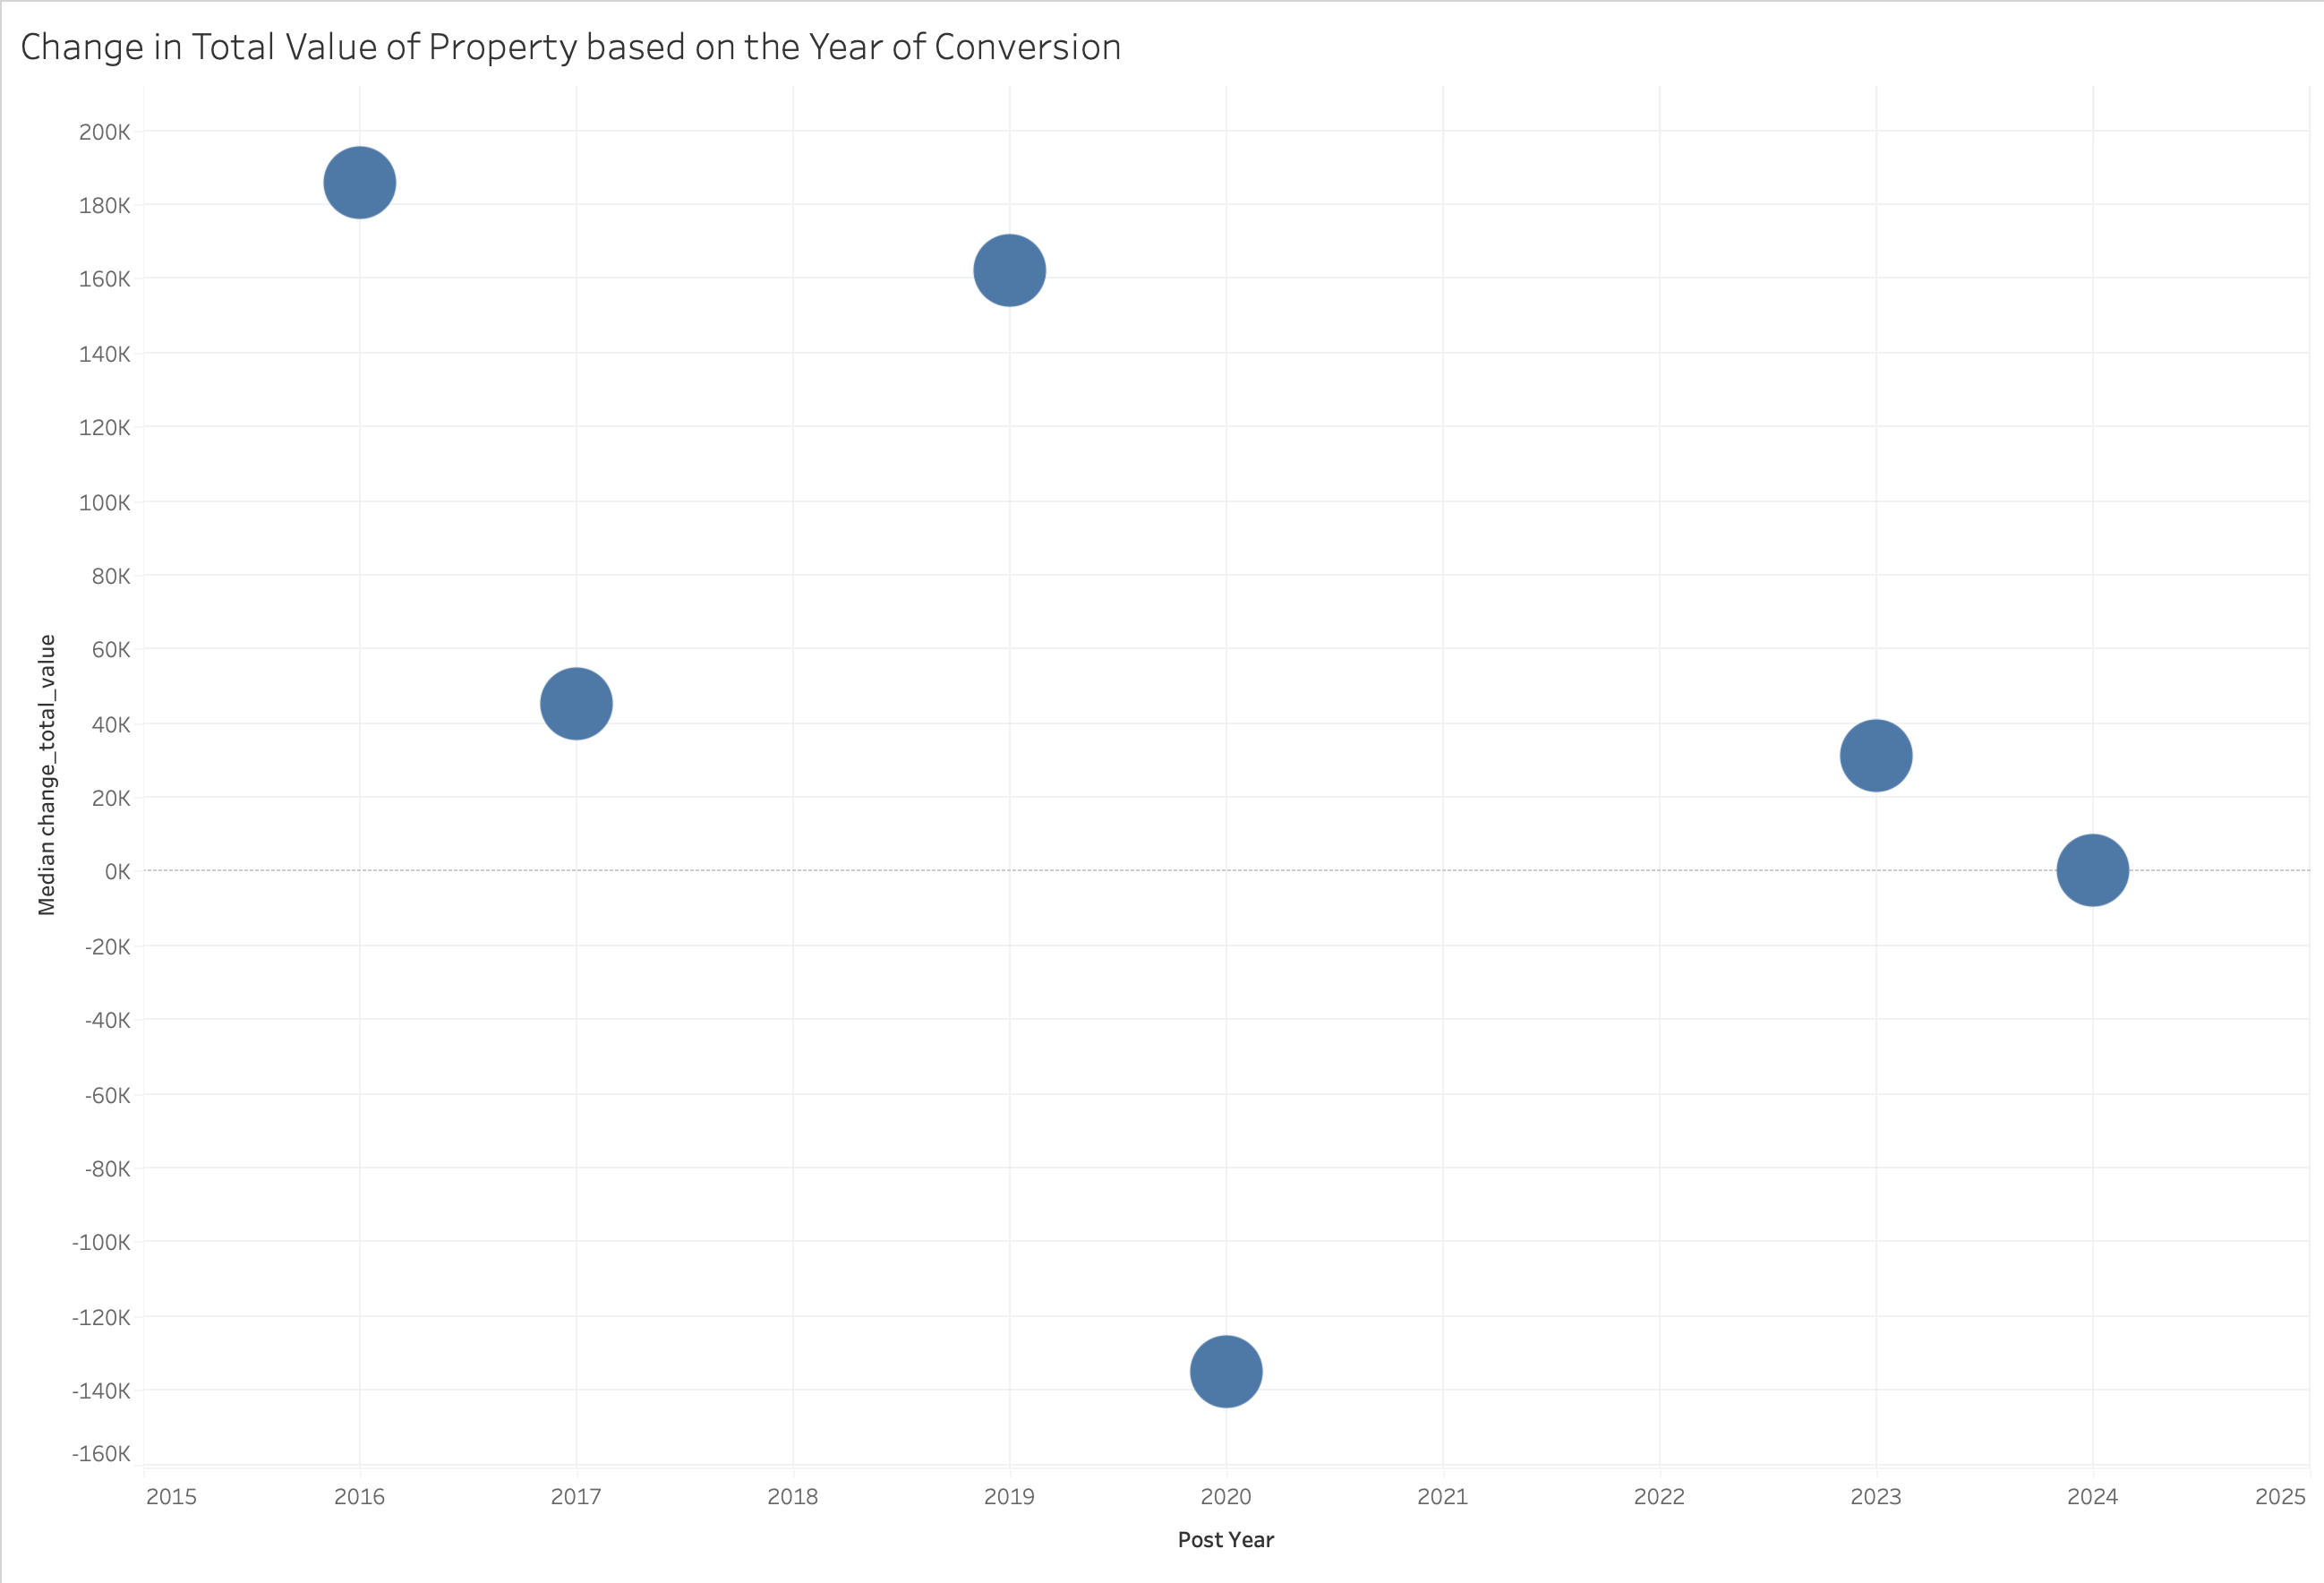
To construct the figure above, I calculated the change in the total value of the property (post value - prior value). From there, the median for each post year was plotted. The median was picked in the case of any outliers to ensure no heavy influences on the data were present, as suggested previously in Figure 3. Building off of this figure in our preliminary analysis, we still see gaps in our data which is expected. However, in 2020, there is a negative change in total valuation of the property. This is plausible due to the start of the pandemic; there were lots of fluctuations in the market. Additionally, the change in total value is quite low for 2024, but since it is only the beginning of the year, we may not have the complete picture of the data just yet.
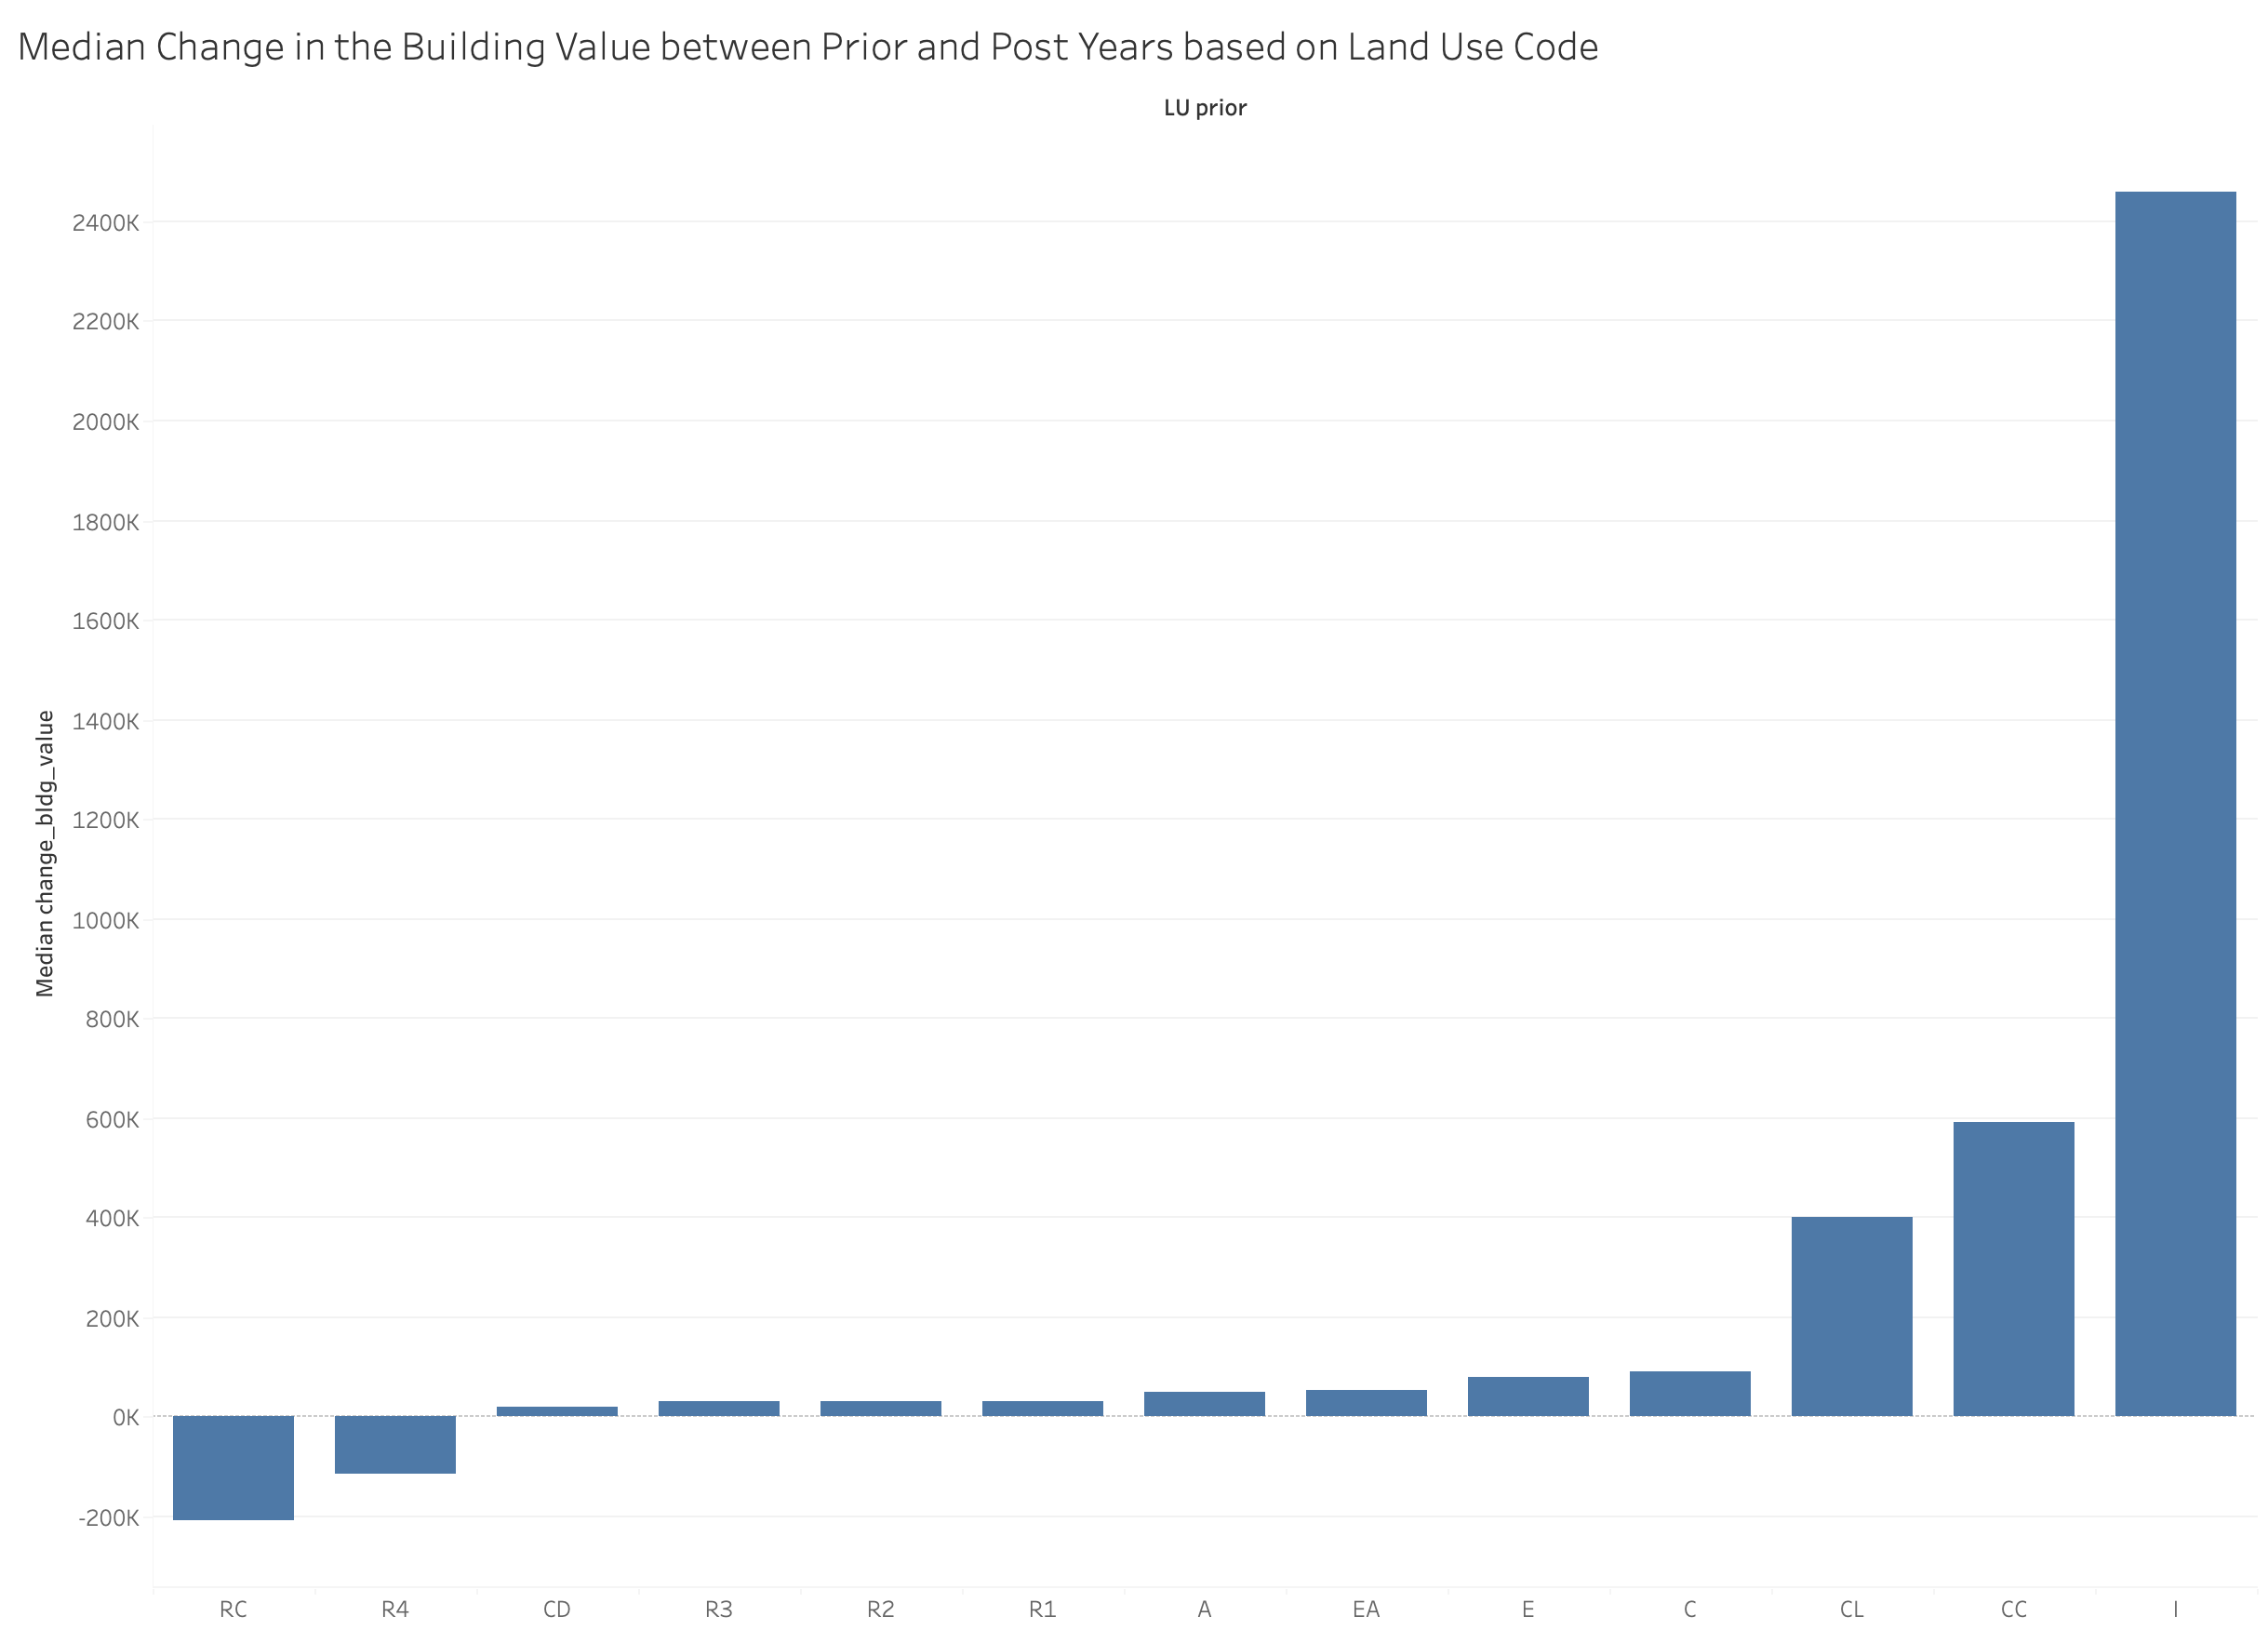
To breakdown the valuation, we examine the change in building value. Most buildings increase in value after the conversion, as seen in the plot. RC and R4 are exceptions that may need further investigation to understand exactly why they are decreasing in value. Also, R2, R3, and CD types don't yield much increase in building valuation. Could this be because there is such a high volume of these conversions and not everyone is guaranteed to succeed? Or, are there are factors at play that are contributing to their high volume?
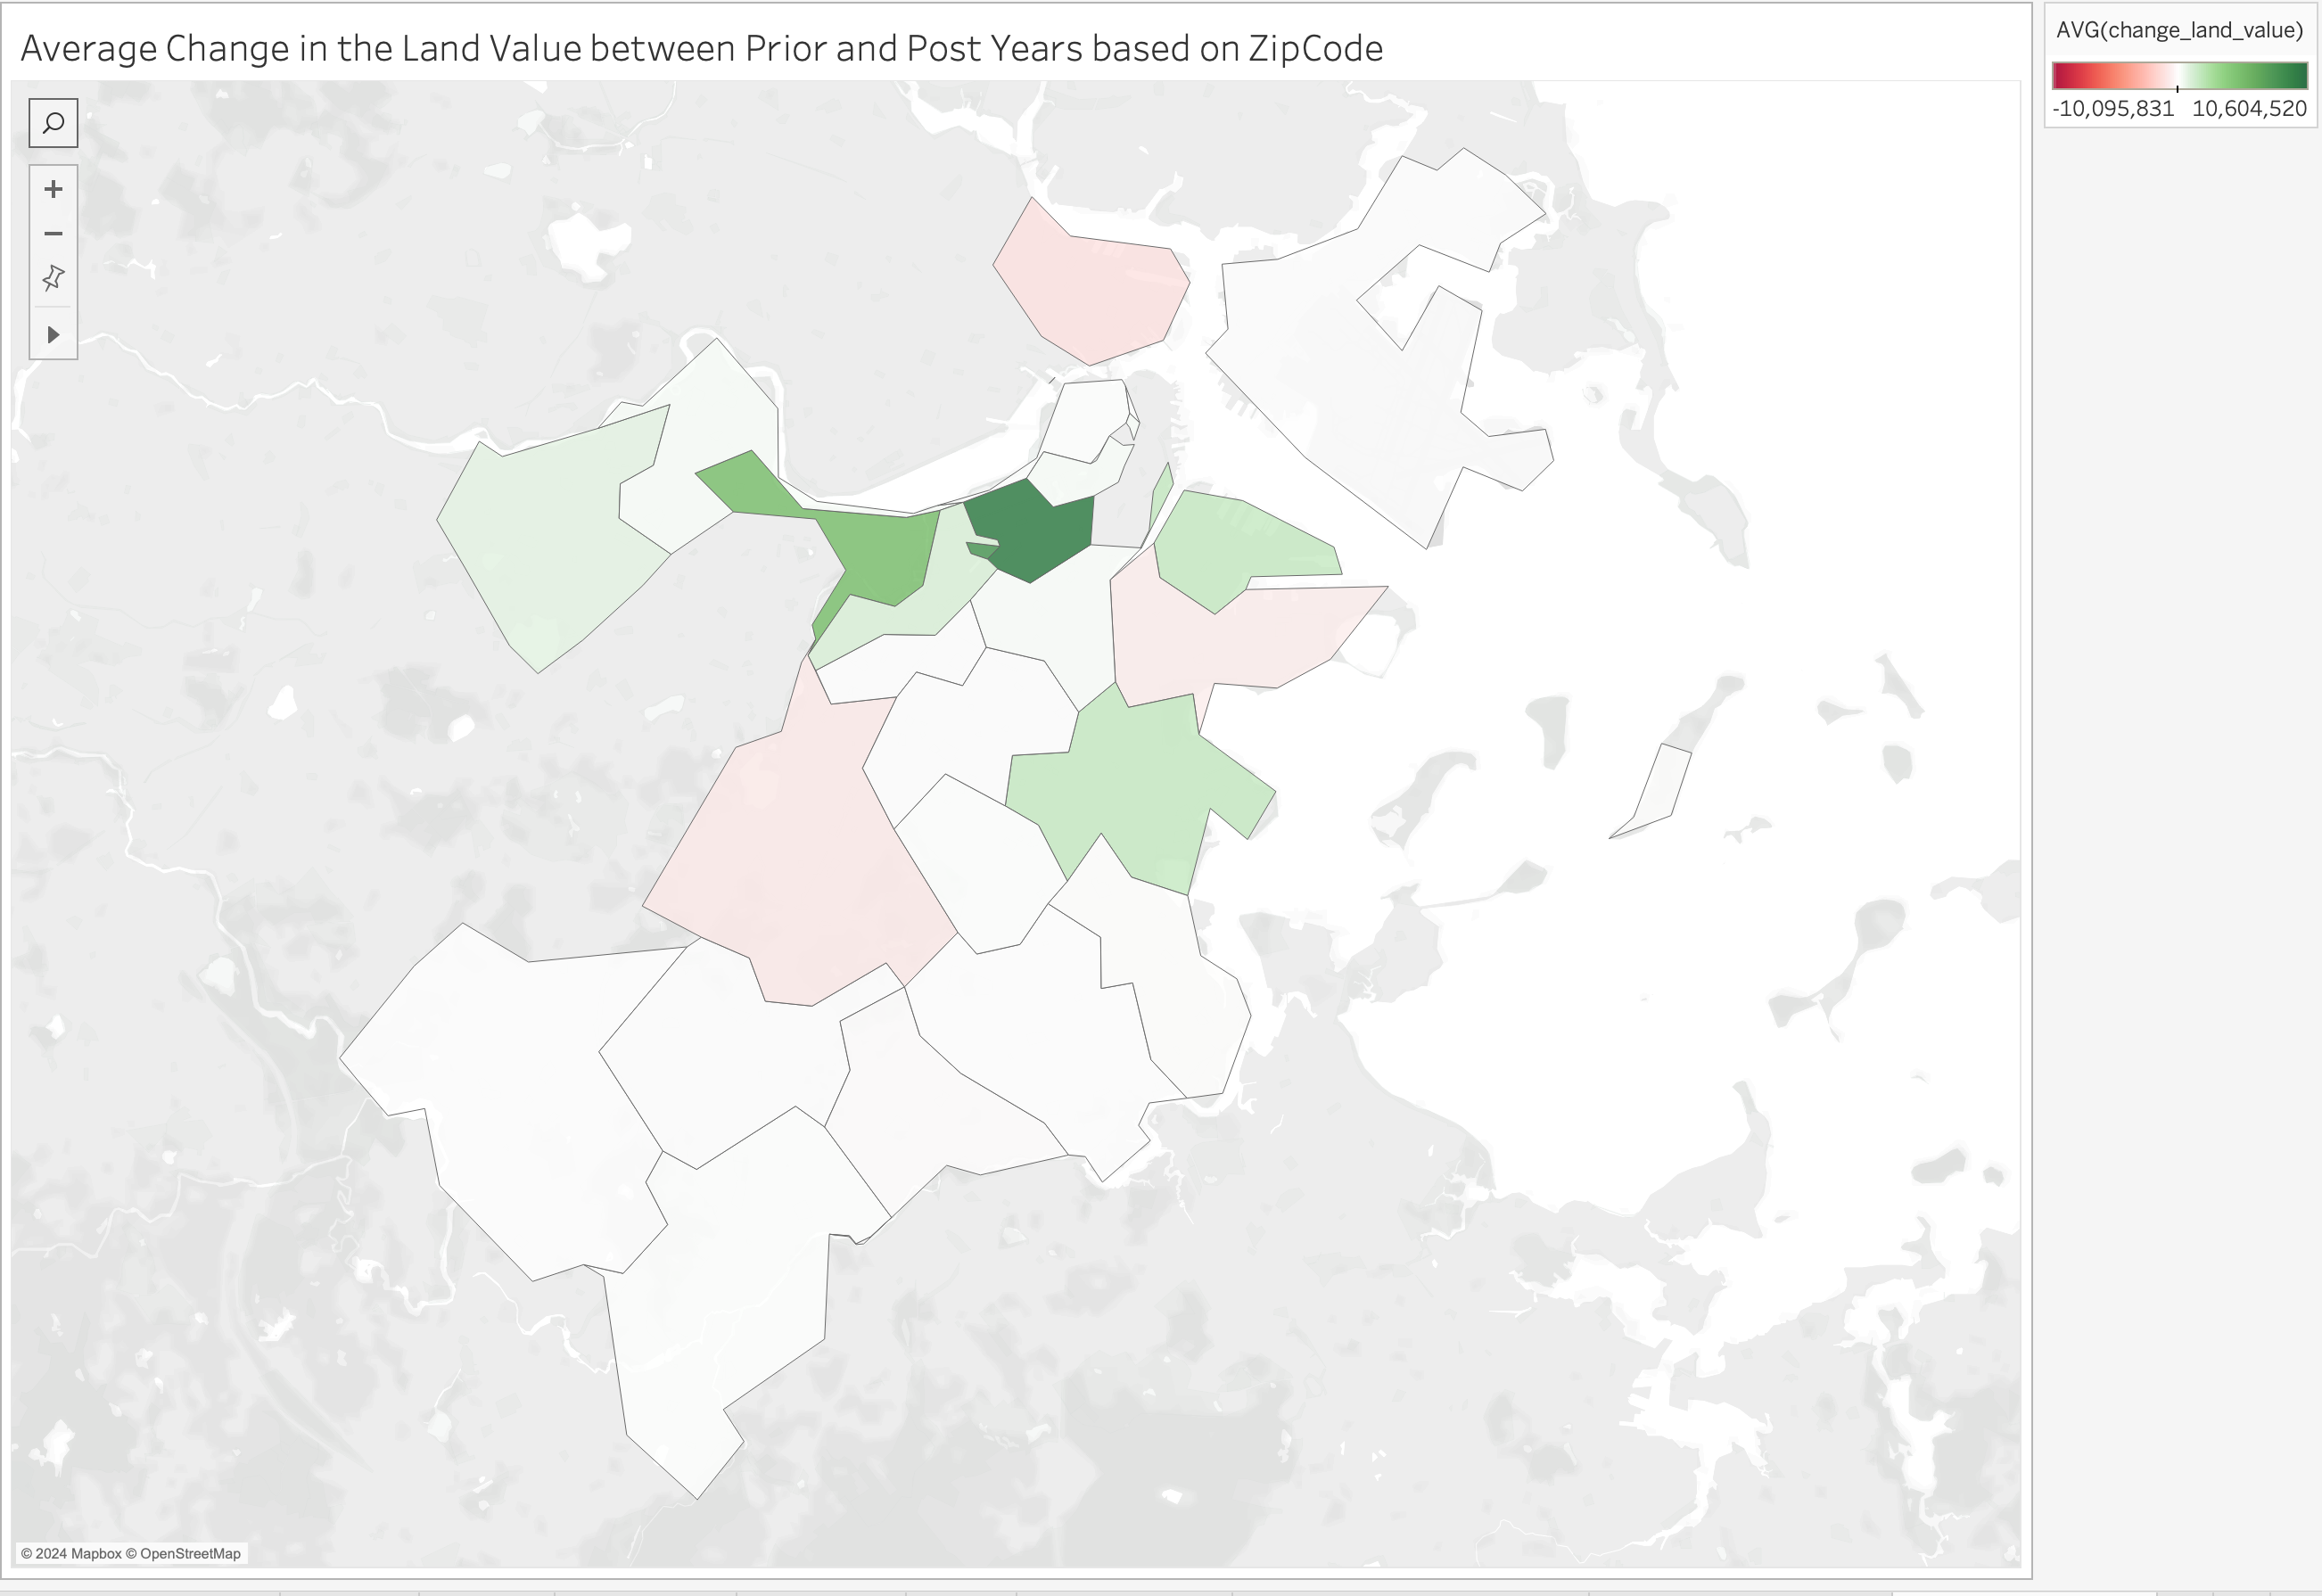
Another aspect of the valuation is attributed to the land value. We notice that areas like 02116, 02115, 02125, and 02210 really benefit from conversions by increasing the land value. However, areas like 02127, 02130, and 02129 experience slight decreases in the prices of land. While it is unclear what exactly determines the increase or decrease in price, most of the building in these areas remained either net 0 or slightly gained in their land property value.
In the past question, we explored the financial incentives for having a conversion of property, specifically the total value, building value, and land value.
Summary
Boston has a severe housing crisis. Recently, many articles tell the story of buildings being converted into condos, and residents being displaced to find new places. I was interested in learning more about the history of these condo conversions and understanding how they impact Boston's population.
An initial glance at the dataset reveals potential gaps in data collection for certain post years. Additionally, there may be default or null values that impact the cleanliness of the data. Lastly, sanity checks were completed to ensure that prior and post property conversions made sense.
Through the deeper analysis of condo conversions in Boston, we notice a significant shift in the city's housing landscape. A large portion of residential buildings containing two to three families were particular targets for conversions. Older buildings, properties built in the early 1900s, were part of a significant number of conversions. A geographic analysis revealed that conversions were more frequent in certain zip codes (02127, 02130, 02131), suggesting a pattern of targeting areas with potentially lower-income households and more affordable housing. To examine the financial incentives that might be available for property conversions, I found that there was mostly an increase in building, land, and total valuation when a conversion happened.
A shift towards condominiums has altered Boston's residential areas, potentially affecting the city's socioeconomic diversity.